ChainLink Price Prediction: LINK Targets $15 After Breaking Key $13.98 Resistance


ChainLink (LINK) price prediction has recently shown signs of regaining bullish momentum after clearing an important technical barrier.
The asset’s climb above $13.98 has prompted renewed interest among technical analysts, with early signs suggesting the potential for further upside.
Short-term market structure supports the notion of continued recovery, following a bounce from localized support near the $13.15 mark. As trading volume stabilizes and bullish indicators emerge across multiple timeframes, LINK now eyes the $15.00 region as its next strategic milestone.
Breakout Momentum and Trading Activity on X
In a recent X post, trading analyst TRADING HUB (@habibmunab) shared a 4-hour LINK/USDT chart highlighting a bullish reversal from the $13.15 support zone. The chart outlined a precise long entry taken at $13.469, which was timed just before LINK initiated its breakout.
A sequence of higher highs and higher lows began forming after this point, signaling ongoing buying pressure and active accumulation. The price then advanced past the $13.983 mark—formerly a resistance level—validating the initial breakout setup and adding strength to the short-term bullish outlook.
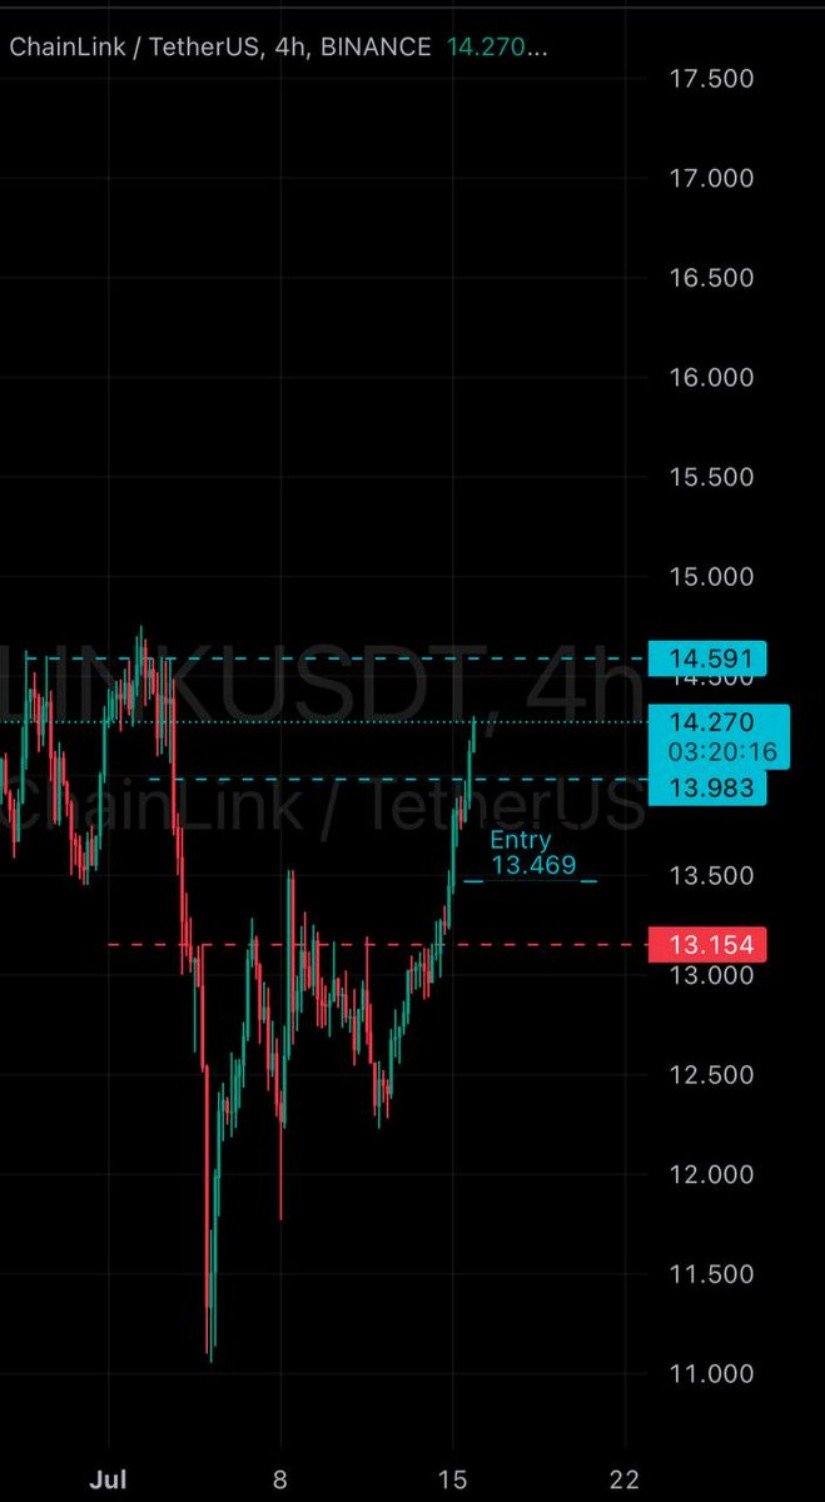
Source: X
Momentum continued to build as LINK approached $14.27, the next resistance zone highlighted by the analyst. The region now serves as a near-term test level that could determine the strength of follow-through buying. A confirmed move above $14.27 would likely open the path toward $14.591, a previously tested level that may serve as a reaction zone due to role reversal.
Traders are now monitoring the consolidation between $13.47 and $13.98 as a potential re-entry area should the price pull back, while a sustained close above $14.27 could accelerate movement toward higher price levels.
ChainLink Price Prediction: Accumulation Patterns and Medium-Term Targets
On the one hand, the 24-hour performance chart shows a mild yet consistent upward trajectory, with LINK price prediction closing at $13.44 and registering a 2.55% gain for the session. The price experienced an intraday dip to around $13.30 but rebounded twice, peaking near $13.45 before entering a stable recovery.
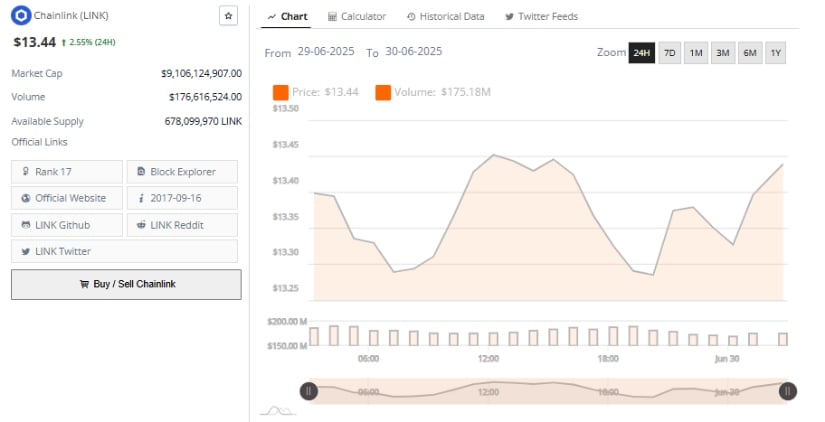
Source: Brave New Coin
Market cap currently stands above $9.1 billion, while trading volume reached approximately $176.6 million, indicating stable participation and liquidity. These dynamics suggest an accumulation phase where buying interest is sustained but measured, reflecting moderate confidence among market participants.
Additionally, technical analyst Dynamite Trader (@Dynamite_Fix) shared a bullish flag pattern forming on LINK’s daily chart. He noted that a breakout above the flag and the daily MA100 could propel LINK toward targets at $14.88, $15.81, $17.13, and even $18.82.
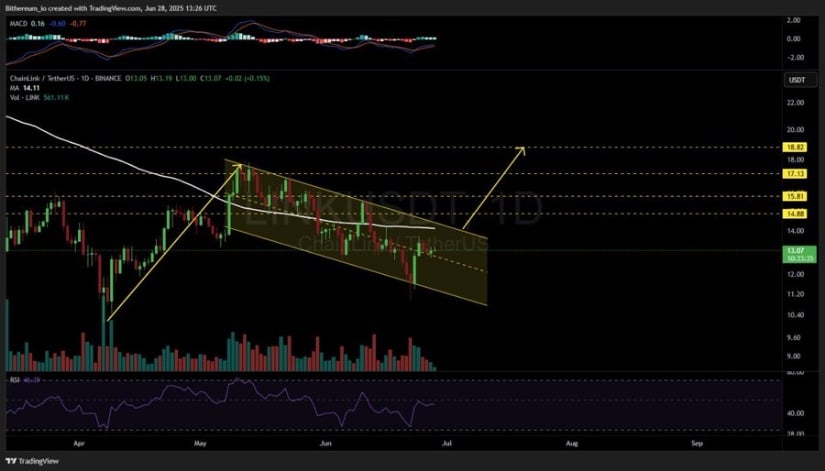
Source: X
While the chart structure supports the potential continuation, the analyst also advised implementing strict stop-loss levels to manage risk. These higher targets align with previously tested zones, reinforcing the technical case for upward extension, provided that price remains supported above $13.98 and momentum continues to build.
Indicators Show Positive Shift in Market Sentiment
On the other hand, recent daily price action suggests that LINK price prediction may be forming a short-term base after reversing from the $10.10 support zone earlier this month. The current price, $13.74, marks a 2.61% increase, adding weight to the case for a sustained rebound.
Price has successfully cleared a recent consolidation zone, and the next technical hurdle is at $16.00, followed by a key resistance at $19.53. The ability to maintain higher lows and breach consolidation ranges suggests growing bullish engagement at current levels.
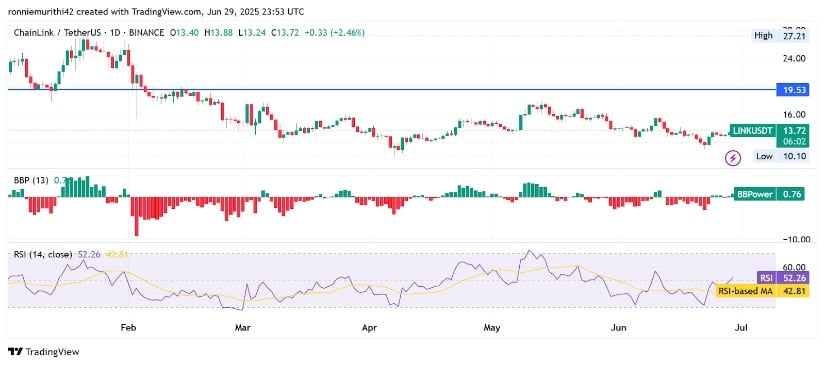
Source: TradingView
The Balance of Power (BBP) indicator has turned positive, registering a reading of +0.75, confirming the return of buyer control. This shift follows a prolonged period of bearish dominance reflected by red histogram bars. The recent green bars indicate the early stages of a market transition, though continued follow-through is required for confirmation. If BBP remains in positive territory, it may support a gradual climb toward medium-term resistance levels.
The Relative Strength Index (RSI) also supports a strengthening bullish outlook. RSI currently stands at 52.42, having recently crossed above its 42.82 moving average. This crossover is considered an early signal of increasing bullish momentum.
A continued rise above the neutral 50 level would add further validation to the ongoing trend. However, if the RSI fails to hold, it could indicate weakening momentum, prompting a short-term correction. Overall, technical indicators suggest a cautiously optimistic environment, with LINK positioned to extend gains if momentum is sustained above current support zones.
 Brave New Coin reaches 500,000+ engaged crypto enthusiasts a month through our website, podcast, newsletters, and YouTube. Get your brand in front of key decision-makers and early adopters. Don’t wait – Secure your spot and drive real impact in Q2. Find out more today!