
Mining giant abandons Bitcoin for ETH staking in major business overhaul
The cryptocurrency mining world got a major shake-up when Bit Digital (NASDAQ: BTBT) announced it was ditching Bitcoin mining altogether. On June 25, 2025, the company dropped the bombshell that it’s going all-in on Ethereum staking and treasury management instead. Mining companies everywhere are now asking the same question: Is this where the industry is headed?
We’re not talking about a simple business tweak here. Bit Digital is completely flipping its script. The company had 24,434.2 ETH (worth about $44.6 million) and 417.6 BTC (approximately $34.5 million) sitting in its treasury as of March 31, 2025. Now they’re planning to sell off all their Bitcoin mining gear and dump their BTC holdings into Ethereum. They’ve even raised $162.9 million specifically to buy more ETH. Talk about putting your money where your mouth is. The scale and timing of this transition are particularly striking. While other mining firms have explored diversification, Bit Digital’s total withdrawal from Bitcoin mining stands out as one of the most pronounced strategic shifts seen in the sector recently.
The Economic Drivers Behind the Exodus
You’re constantly buying expensive hardware that becomes obsolete faster than you can say “mining difficulty adjustment.” Then there’s the halving events every four years that cut your rewards in half. Only the biggest, most efficient operations survive this game.
BTCS CEO Charles Allen put it perfectly: “Ethereum staking, by contrast, offers cleaner economics — yield without the expensive energy costs and rapidly depreciating assets.” The math really does work out better. Instead of burning through electricity and constantly upgrading hardware, Ethereum staking gives you steady returns with way less overhead. Right now, staking yields are running between 3% and 5% annually, though that can change based on how much ETH gets staked overall. With over 35 million ETH, representing 28% of its total supply, now staked, this trend highlights increasing institutional trust in this method.
Environmental factors also play a crucial role. The carbon footprint associated with Bitcoin mining has faced growing criticism from both regulatory bodies and investors. Ethereum’s shift to a proof-of-stake consensus mechanism, completed with The Merge in September 2022, slashed its energy consumption by approximately 99.95%, thereby enhancing its appeal to environmentally and socially responsible (ESG) investors.
Industry Implications: A Template for Transformation?
Bit Digital’s strategic shift occurs at a critical juncture for the mining sector. This move might offer a model for other mining companies grappling with similar challenges. Ethereum’s proof-of-stake system enables businesses to generate returns, typically between 4% and 6.5% annually, by locking up ETH to support network security. This presents a compelling alternative to the high capital demands of traditional mining.
Several indicators suggest this strategic pivot could encourage similar approaches from other companies:
- Regulatory Scrutiny: Governments globally are enacting more stringent environmental regulations, potentially affecting energy-intensive mining operations. Regulations like the EU’s MiCA and various US state initiatives are driving the industry towards more sustainable operational models.
- Investor Demand: Major institutional investors are increasingly favoring proof-of-stake networks, seeing them as more compatible with their sustainability objectives. This redirection of capital may compel mining companies to revise their business strategies.
- Operational Predictability: The consistent nature of staking rewards, contrasted with the fluctuating returns from mining, facilitates more precise financial forecasting. Businesses can thereby achieve greater clarity in predicting cash flows and developing long-term plans.
Nevertheless, this transition presents its own set of obstacles. Mining firms would face the task of selling off costly hardware, likely incurring substantial losses, and simultaneously establishing entirely new technical frameworks for staking activities. Furthermore, the regulatory environment surrounding staking is still developing, requiring companies to manage evolving compliance obligations.
Market Reactions and Financial Implications
Initial market reactions to Bit Digital’s announcement were varied. The company’s stock price experienced a decline, reaching a low of $1.86, before seeing a modest recovery after the announcement of its strategic pivot and a $150 million share offering. This price fluctuation underscores investor uncertainty regarding the successful implementation and ultimate financial viability of the transition.
The financial strategy underpinning this transformation is notably aggressive. By securing $162.9 million designated explicitly for Ethereum acquisitions, Bit Digital is effectively placing a leveraged wager on Ethereum’s future value. This approach magnifies both potential gains and inherent risks, given that fluctuations in Ethereum’s price can profoundly affect the company’s financial outcomes.
Some critics contend that this pivot effectively recasts Bit Digital from an operational cryptocurrency enterprise into a leveraged investment vehicle for ETH. Conversely, proponents argue that the company is strategically positioning itself to lead a fundamental evolution in the operational and security paradigms of cryptocurrency networks.
Technical Considerations and Risks
Shifting to Ethereum staking introduces significant technical challenges that go beyond mere asset exchange. Successful staking operations necessitate robust validator infrastructure, advanced monitoring capabilities, and stringent security measures to avert “slashing” penalties—sanctions applied to validators for non-compliance with network stipulations.
Bit Digital must cultivate proficiency in managing validators, which includes mastering optimal staking strategies, ensuring high operational uptime, and mitigating risks linked to future network enhancements or protocol modifications. The company’s ultimate success will hinge on its capacity for flawless execution of these technical demands.
Furthermore, concentration risk is a considerable factor. While Bitcoin miners have access to various hedging strategies, engaging in Ethereum staking creates direct exposure to fluctuations in ETH’s market price. A significant drop in Ethereum’s valuation could severely compromise the company’s financial standing, irrespective of its staking yields.
Looking Forward: Pioneer or Cautionary Tale?
Bit Digital’s strategic transformation marks a major milestone in the history of cryptocurrency mining. The company is fundamentally wagering that the Ethereum proof-of-stake ecosystem will ultimately yield greater long-term returns than traditional Bitcoin mining operations.
The potential impact on the broader crypto mining industry is significant. Should Bit Digital navigate this transition successfully and achieve superior financial performance, it could inspire similar strategic shifts throughout the sector. Conversely, a failure in this strategy might serve as a warning regarding the perils of abandoning established business models.
Bit Digital’s strategy of divesting its high-performance computing services while intensifying its focus on Ethereum indicates a defined strategic direction. By retaining an interest in related technologies while concentrating its core activities on staking, Bit Digital aims to establish itself as a holistic provider of blockchain infrastructure.
Within the cryptocurrency industry, Bit Digital’s evolution offers a compelling subject for studying strategic adaptation. The success of this ambitious undertaking—whether it proves insightful or ill-timed—will likely be determined by Ethereum’s ongoing progress, evolving regulatory landscapes, and the overarching shifts in cryptocurrency economics.
The ensuing months will be pivotal for Bit Digital as it implements this ambitious pivot. The outcome of its efforts could sway strategic choices across the cryptocurrency mining industry, potentially redefining operational approaches for businesses navigating an increasingly intricate and regulated market. As the cryptocurrency sector matures, Bit Digital’s strategic shift might ultimately be viewed as either a forward-thinking maneuver or a cautionary example of the risks associated with departing from established business models. Regardless, this development warrants close observation from all cryptocurrency investors and industry stakeholders.
]]>
UPDATED July 07th 2025. Who offers the best crypto interest rates? With the growth of DeFi & CeFi applications, crypto lending, margin exchanges, and stakeable cryptocurrencies over the last few years, it can be difficult to know where the best crypto yields for your idle capital are. Following on from our guide to crypto yield farming, this survey looks into the major crypto lending platforms and examines the different interest rates offered by them.
First, an understanding of the difference between ‘crypto lending’ and ‘crypto borrowing’ in the context of this article is important. If you are lending in the scenarios below you are loaning your assets to the platforms featured with the expectation that you will earn interest on your crypto assets. Your goal is the return of your original sum, with earned interest. This article does not explore crypto borrowing – where you would borrow assets (or fiat in some cases) from a platform, which you would be required to repay – with additional interest. For the best crypto borrowing rates check here.
The question of which is the best crypto lending platform is open to debate – as each has its own approach and processes – but certainly annual interest rates paid are a good place to start. All interest rates were recorded on July 07th 2025 and are subject to change. A rate of zero on a specific platform means the coin is temporarily unavailable there. It does not mean 0% interest. Rates displayed are typically maximums and may come with additional platform terms & conditions.
Best Crypto Interest Rates
Stablecoin Rates
|
USDC |
DAI |
USDT |
USDP |
TUSD |
BUSD |
||
 |
8%
|
8%
|
8%
|
0%
|
8%
|
12%
|
|
 |
6.18%
|
6.96%
|
–
|
–
|
–
|
–
|
|
 |
14%
|
14%
|
16%
|
0%
|
14%
|
–
|
|
|
|
1.76%
|
–
|
1.84%
|
–
|
–
|
–
|
|
|
|
–
|
–
|
6%
|
–
|
–
|
–
|
|
 |
3.45%
|
3.24%
|
3.61%
|
11.96%
|
3.54%
|
–
|
|
 |
6.5%
|
–
|
–
|
–
|
–
|
–
|
|
 |
5%
|
9.37%
|
5.08%
|
–
|
–
|
0%
|
|
 |
4.06%
|
2.79%
|
3.49%
|
0%
|
0%
|
0%
|
|
 |
13%
|
–
|
13%
|
–
|
–
|
–
|
|
 |
0%
|
5%
|
0%
|
2%
|
0%
|
–
|
|
 |
5%
|
–
|
5%
|
–
|
–
|
–
|
|

Cryptocurrency Rates
|
BTC |
ETH |
WBTC |
LINK |
UNI |
TRX |
YFI |
SOL |
DOT |
ADA |
||
|
|
5%
|
5%
|
–
|
5%
|
5%
|
5%
|
5%
|
–
|
7%
|
5%
|
|
|
|
–
|
3.74%
|
0%
|
–
|
–
|
–
|
–
|
–
|
–
|
–
|
|
|
|
7%
|
8%
|
–
|
7%
|
–
|
–
|
–
|
8%
|
15%
|
8%
|
|
|
|
1.25%
|
2.9%
|
–
|
0.35%
|
3.06%
|
0%
|
–
|
4.95%
|
9.13%
|
1.77%
|
|
|
|
2.5%
|
3.5%
|
–
|
4.5%
|
3.5%
|
3.8%
|
–
|
6%
|
–
|
–
|
|
|
|
–
|
0.02%
|
0.01%
|
0.03%
|
0.2%
|
0%
|
0.5%
|
–
|
–
|
–
|
|
|
|
0%
|
–
|
–
|
–
|
–
|
–
|
–
|
–
|
–
|
–
|
|
|
|
–
|
0.03%
|
3.88%
|
0%
|
0%
|
0%
|
0%
|
–
|
0%
|
0%
|
|
|
|
–
|
1.9%
|
0.01%
|
0.01%
|
0.03%
|
0%
|
0%
|
–
|
–
|
–
|
|
|
|
4.5%
|
4.5%
|
–
|
–
|
–
|
–
|
–
|
–
|
–
|
–
|
|
|
|
3%
|
3.5%
|
–
|
0%
|
0%
|
0%
|
–
|
5%
|
8.5%
|
3.5%
|
|
An introduction to crypto loans
The other side of lending is of course borrowing. If you are interested in taking a loan out (for USD for example) many of the providers above also provide that service. Check here for the latest borrowing rates.
Most major Lending and borrowing protocols across both CeFi and DeFi require borrowers to lock up an asset in order to take out a loan. These types of loans are called collateralized loans.
Collateralization is a borrower’s commitment to pledge a number of assets as a means for a lender to recoup their capital in the instance that the borrower defaults on the loan. If a borrower continually missed payments on a loan obligation then the lender has the right to possess the collateral pledged in the case that the loan defaults.
Collateralized, or more specifically ‘overcollaterized loans’, are at the core of efficiently operating DeFi lending markers. DeFi lending protocols enable open, permissionless, and pseudo-anonymous financial services. There are no credit score requirements for borrowers and generally no formal KYC or AML requirements.
In order to maintain a balance between open access and systemic stability the value of the collateral that needs to be pledged for DeFi loans has to exceed the value of the loans. If for example, a DeFi user wants to directly take out a USD100 DAI loan on Makerdao, they need to put up at least USD150 worth of Ethereum.
Borrowing from DeFi protocols can often be a precarious and time-intensive process that goes beyond simply paying back interest in installments.
The loan-to-value ratio (LTV) needs to be carefully monitored to ensure that the collateralization requirement that was agreed upon before the loan was executed is maintained. Maintaining this LTV ratio is made more difficult if borrowers put up volatile assets like ETH as collateral. If the value of ETH changes suddenly in US dollar terms, loans can be liquidated very quickly and borrowers are not protected by mechanisms that exist like loan insurance.
For these reasons, due to the complex nature of unique specific DeFi protocol agreements that go beyond interest rate payments, BNC has chosen not to include details around DeFi protocol borrowing rates.
Programmable Money: Tools that find the best crypto interest rates for you automatically
These days yield optimization platforms like Yearn.finance exist. They use the Ethereum blockchain’s capabilities to facilitate programmable money to make it easier for users to find optimal interest rates automatically. Before Yearn, users seeking to maximize their yields needed to manually move their stablecoins between lending protocols. A slow, labor-intensive process that Yearn aims to avoid.
The protocol works by creating pools for each asset that is deposited. When a user deposits their stablecoins into one of these pools, they receive yTokens that are yield-bearing equivalents of the coin that was deposited. If for example, a user deposits DAI into the protocol it will issue back yDAI.
Assets are automatically shifted between lending platforms in the DeFi ecosystem like Compound and Aave, where interest rates for deposited assets change dynamically. Every time a new user deposits assets into a pool on Yearn, the protocol checks whether there are opportunities for higher yield and rebalances the entire pool if necessary. At any time a user can burn their yDAI and withdraw their initial deposits and accrued interest in the form of the original deposit asset.
The protocol has evolved to offer more complex solutions that can efficiently maximize yields on user deposits. The yCRV liquidity pool built by Yearn on the Curve finance platform contains the following yTokens: yDAI, yUSDC, yUSDT, yTUSD and pays back a yCRV token that represents the index. Users can deposit any of the four native stablecoins into the pool and earn interest back from yield-bearing yCRV tokens. Depositors also earn trading fees from Curve for providing liquidity to other users of the platform.
]]>
As geopolitical tensions continue to shape global markets, cryptocurrency investors are questioning whether Bitcoin can serve as a reliable sanctuary during turbulent times
The debate has intensified as recent geopolitical events have provided real-world stress tests for cryptocurrency markets. While Bitcoin’s decentralized nature and fixed supply cap make it theoretically attractive as a hedge against traditional financial system risks, its price behavior during crises tells a more complex story.
The Digital Gold Narrative: Promise vs. Reality
Bitcoin’s appeal as a potential safe haven stems from its unique characteristics. Unlike traditional currencies controlled by central banks, Bitcoin operates on a decentralized network immune to government interference. Its programmed scarcity—capped at 21 million coins—mirrors gold’s finite supply, theoretically protecting against inflation that erodes fiat currency value.
However, recent research presents mixed findings. Using S&P 500 and GPR index weekly data, studies estimate that Bitcoin and the Swiss Franc function as safe havens in relation to geopolitical risk during market crashes while Gold and Treasury bonds do not. This suggests Bitcoin may actually outperform traditional safe havens in specific scenarios.
Yet Bitcoin’s notorious volatility remains a significant concern. Traditional safe havens provide stability during uncertainty, but Bitcoin’s price swings can be dramatic and unpredictable, raising questions about its suitability for risk-averse investors seeking stability.
Recent Geopolitical Events: A Tale of Two Reactions
The cryptocurrency market’s response to recent Middle Eastern tensions illustrates Bitcoin’s complex relationship with geopolitical risk. In April 2024, when Iran launched military strikes against Israel, Bitcoin experienced a sharp selloff, plummeting from approximately $70,000 to below $62,000. Similarly, heightened tensions in June 2025 saw Bitcoin dip below $104,000.
These initial reactions mirror those of traditional risk assets rather than safe havens. Standard Chartered analysts noted that risks stemming from Middle East conflicts pushed bitcoin below $60K, suggesting institutional investors initially treat Bitcoin as a risk-on asset during immediate crisis periods.
However, Bitcoin’s recovery patterns tell a different story. Despite ongoing geopolitical tensions, Bitcoin has demonstrated remarkable resilience, bouncing back above $105,000 and currently trading around $108,793 as of early July 2025. This recovery ability, even amid persistent uncertainty, suggests underlying strength that may appeal to longer-term investors.
Historical precedents support this recovery narrative. During the 2013 Cyprus banking crisis and Syrian conflict, investors reportedly turned to Bitcoin as an alternative store of value, driving significant price appreciation. Similarly, North Korean political tensions in 2017 coincided with increased Bitcoin demand and substantial price gains.
The Institutional Factor: Changing Market Dynamics
The cryptocurrency landscape has evolved dramatically since Bitcoin’s early days. Major financial institutions have significantly increased their adoption and integration of Bitcoin, with institutional adoption surging 50% in 2024, marking a pivotal shift in the cryptocurrency’s legitimacy.
This institutional embrace could fundamentally alter Bitcoin’s safe haven potential. Professional investors with over $100m under management hold $27.4 billion worth of Bitcoin ETFs as of Q4 2024, a 114% increase from the previous quarter’s $12.4 billion. Such substantial institutional backing may provide stability and reduce volatility over time.
The introduction of Bitcoin ETFs has been particularly transformative, offering traditional investors regulated exposure to Bitcoin without direct custody concerns. This development bridges the gap between traditional finance and cryptocurrency markets, potentially making Bitcoin more palatable to conservative institutional investors.
Regulatory Winds and Market Maturity
Regulatory clarity continues to shape Bitcoin’s trajectory as a potential safe haven. Regulations are shifting, making crypto more accessible for big firms, with former U.S. President Donald Trump signing an executive order on January 23, 2025, to create a crypto-focused working group. Such regulatory developments may reduce uncertainty and support Bitcoin’s legitimacy as an institutional asset.
The growing acceptance of cryptocurrency in traditional finance suggests Bitcoin may be maturing beyond its speculative origins. As regulatory frameworks solidify and institutional infrastructure develops, Bitcoin’s price behavior may become more predictable and less correlated with risk assets.
The Verdict: Tactical Hedge or True Safe Haven?
Current evidence suggests Bitcoin occupies a unique position in the safe haven spectrum. While it may not match gold’s consistent stability during immediate crisis periods, ongoing conflicts, particularly in Europe and the Middle East, are increasing demand for alternative assets like Bitcoin that are perceived as safe havens in times of uncertainty.
Bitcoin appears to function more as a “tactical hedge” rather than a traditional safe haven. Its decentralized nature and limited supply provide theoretical protection against systemic financial risks, while its recovery capacity following initial crisis-driven selloffs demonstrates underlying resilience.
For cryptocurrency investors, understanding Bitcoin’s nuanced relationship with geopolitical events is crucial. While it may not provide the immediate stability of gold during crisis onset, its medium-term recovery potential and growing institutional support suggest it could serve as a valuable portfolio diversifier.
The question isn’t whether Bitcoin perfectly replicates traditional safe havens, but whether it offers unique value propositions that complement existing hedging strategies. As the cryptocurrency market matures and institutional adoption accelerates, Bitcoin’s role as a digital store of value may become increasingly significant in globally diversified portfolios.
]]>
Cardano is starting to show real signs of life again after weeks of dull price action. ADA is currently trading at $0.57 as it confirms flipping green on the weekly chart, and market participants are now watching closely as key reversal signals start stacking up.
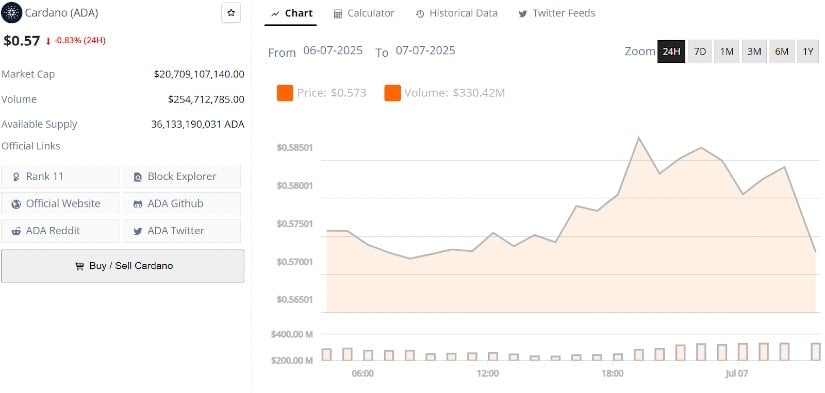
Cardano’s current price is $0.57.00, down -0.83% in the last 24 hours. Source: Brave New Coin
Cardano Turns Weekly Candle Into Green
Cardano just flipped green on the weekly timeframe, marking a notable shift after weeks of downward pressure. As shared by analyst Av_Sebastian, the candle is closing firmly above $0.58. This weekly close is the first strong sign of buyer strength returning, and it opens the door for potential continuation in the coming sessions.
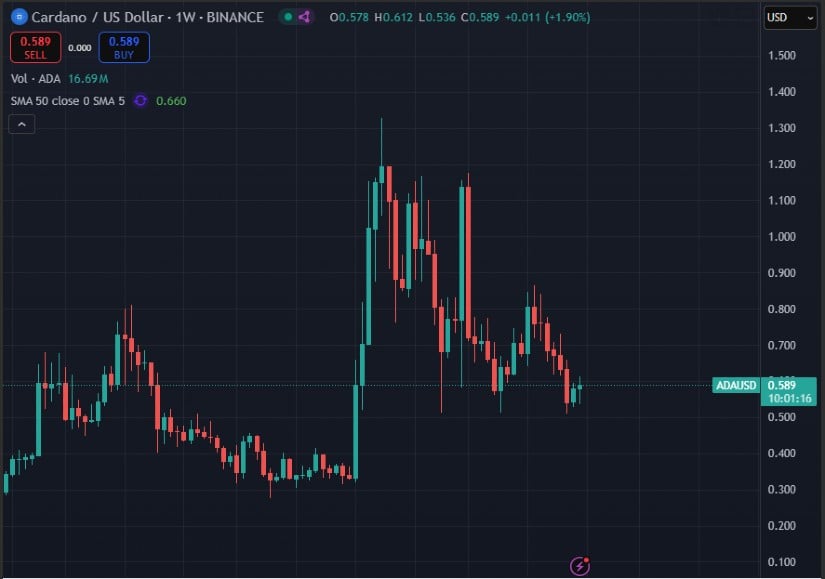
ADA flips its weekly candle green, signaling a potential trend reversal. Source: Av_Sebastian via X
On the chart, ADA has found support multiple times just above the $0.50–$0.52 zone, and now it’s pushing off that floor with rising volume. If momentum builds and price breaks above the $0.61 to $0.63 resistance cluster, it would confirm a short-term reversal and possibly target the $0.70 range next. For now, bulls will want to see the $0.58 level hold to keep the structure intact.
Cardano Price Successfully Retests Ichimoku Cloud
Building on its recent weekly strength, Cardano just made a significant move on the 2-week chart, breaking above the Ichimoku cloud in late 2024. As noted by Cantonese Cat, the breakout was followed by a textbook back-test of the cloud’s upper boundary, a move that often signals a shift in trend. The structure also shows a consistent pattern of higher lows and higher highs.
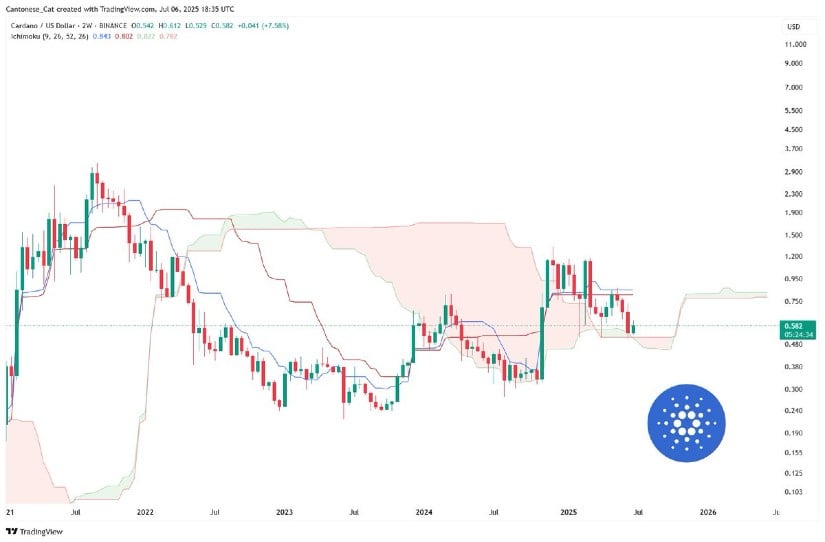
Cardano confirms a bullish Ichimoku breakout with a clean retest on the 2-week chart, eyeing the $0.70–$0.80 zone next. Source: Cantonese Cat via X
What makes this setup even more compelling is that ADA has historically respected Ichimoku signals on longer timeframes. With the breakout and retest in play, a continuation move toward the $0.70 to $0.80 region becomes a real possibility. For now, maintaining the structure above the cloud and pushing beyond the $0.63 resistance cluster would add further confirmation to the bullish case.
Cardano Network Activity Backing Technicals
On top of bullish technicals, Cardano just posted a massive on-chain milestone. According to TapTools, the network processed 276 billion ADA worth of transactions over the past 67 days, equivalent to roughly $165 billion at market prices.
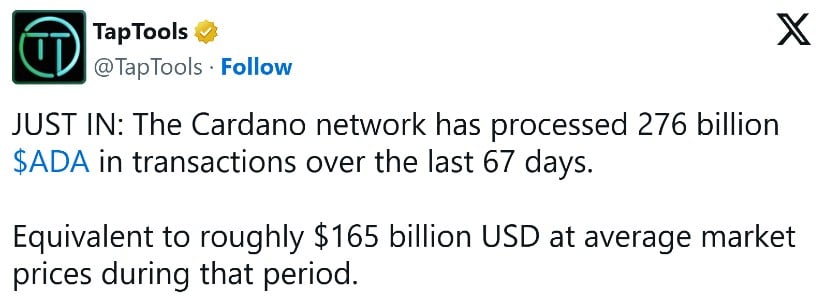
Cardano processes 276B ADA in just over two months, signaling growing network strength. Source: TapTools via X
This sustained throughput adds more weight to the recent technical strength. First came the weekly candle flip, then the Ichimoku cloud retest, and now this surge in network volume helps round out the bullish picture. If Cardano price continues to hold above key support levels and the usage numbers stay this elevated, the foundation for a stronger breakout toward the $0.70+ range becomes more likely.
Cardano Price Prediction: Bounce Zone Setup Targets $1.41
Cardano is now sitting right at a major bounce zone on the weekly chart. According to analyst Claire, the $0.50 to $0.52 region has already seen two significant reactions, and this third touch could be the make moment. The chart outlines a triple bottom structure with a falling wedge pattern forming overhead. If bulls defend this support and push off convincingly, key upside targets emerge at $0.9024, $1.1281, and $1.4160.
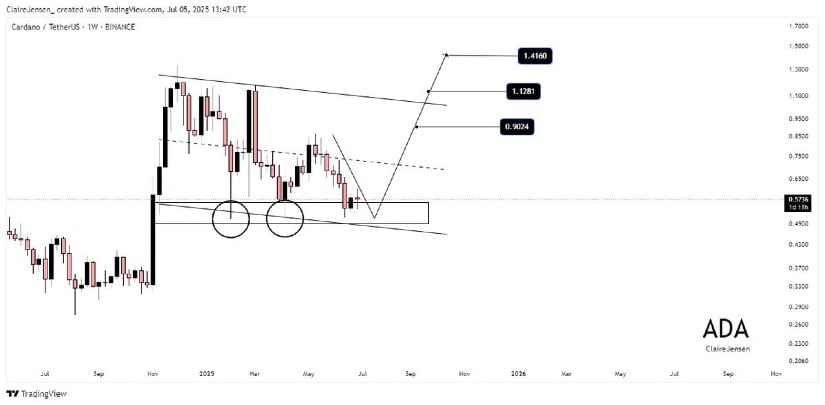
Cardano sits at a key bounce zone with a triple bottom forming, with targets set at $1.41. Source: Claire via X
The levels are clean, the structure is mature. The wider descending channel adds extra weight to this setup, as any breakout would shift ADA into a new bullish phase. While Cardano price has already started to post green candles on the weekly but, the next few weekly candles will be important.
ADA Price Analysis
Just like the weekly chart, the lower-timeframe setup for ADA price is starting to form a potential triple bottom. Analyst Ali highlights the $0.54 zone as a key level to watch; price has bounced off it multiple times, and it now lines up with a strong support region.
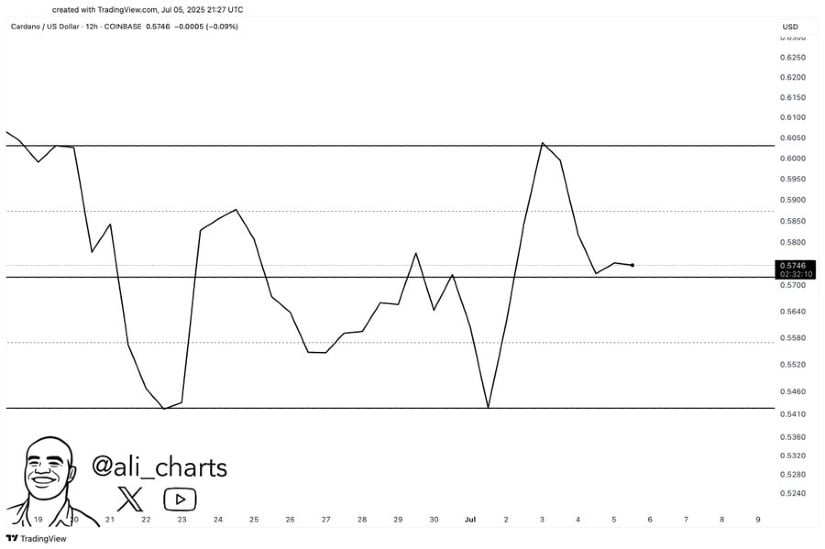
ADA forms a potential triple bottom near $0.54 on lower time frames. Source: Ali via X
If ADA revisits this area and holds, it could trigger a sharp rebound, especially with momentum building on the higher timeframes. This setup reflects a classic reversal structure, and a confirmed bounce here would further strengthen the broader bullish case.
Final Thoughts
Cardano’s recent bounce isn’t just another random green candle; it’s backed by solid technicals, strong on-chain metrics, and growing sentiment. From flipping the weekly chart green to retesting the Ichimoku cloud on the 2-week, ADA is quietly stacking signals that suggest bulls are about to take complete control.
If ADA holds its footing above $0.58 and breaks cleanly past the $0.63 resistance zone, things could move fast. With targets ranging from $0.70 to $1.41, Cardano may finally be ready to step back into the spotlight.
]]>
A Party Built on Fiscal Fury
Musk’s jump into politics was triggered when his sometime-buddy-turned-nemesis Donald Trump rammed the $3.4 trillion “Big, Beautiful Bill” through Congress last week, ballooning the U.S. deficit past $36 trillion. Musk called the package a “disgusting abomination” and unveiled the America Party as a protest vehicle promising to target a handful of razor-thin House and Senate races to become a swing-vote king-maker.

The X Post that signals Elon Might be Reengaging with Bitcoin, Source: X
Elon + Bitcoin: A Love Story With Mood Swings
This isn’t Musk’s first dance with the orange coin. He parked $1.5 billion of Tesla’s treasury into BTC in February 2021, briefly accepted it for Model Ys, freaked out over coal-powered mining, then yanked the checkout button 49 days later.
By July 2022 Tesla off-loaded 75 percent of its stash—blaming China’s COVID lockdowns—yet it still holds about 10 k BTC worth $1.05 billion today and didn’t sell a satoshi in Q1 2025.
The environmental about-face may be moot now. Independent audits show Bitcoin mining has crossed the 50 percent renewable-energy threshold Musk demanded before re-opening Tesla’s checkout cart.

Bitcoin is sitting pretty above $109,000 looking primed for new all-time highs, Source: BNC Bitcoin Liquid Index
Why Back Bitcoin Now? Follow the Money, Honey
- Post-Halving Scarcity. The April 2024 halving chopped new supply to 3.125 BTC every ten minutes. Historically, price lag-pumps follow 9-18 months later—right when the 2026 mid-terms would heat up.
- Institutional Floodgates. U.S. spot ETFs have sucked up $49 billion year-to-date, with BlackRock’s iShares fund now fatter than the largest gold ETF. That’s a structural demand hose Musk can ride instead of fight.
- Bitcoin ≈ Fiscal Hedge. As Trump’s mega-bill detonates the deficit and the Fed tip-toes toward rate cuts, hard-capped Bitcoin looks downright Protestant next to the drunken-sailor dollar.
- Price Sweet-Spot. BTC hovers around $110 k—just shy of its May 22 all-time high of $112 k—after a 15 percent YTD climb. That leaves upside if ETFs keep vacuuming supply or if Washington’s debt binge accelerates the flight to hard assets.
Political Upside for Musk
Third parties usually fail, but Musk is playing disruptor, not president. Capture three Senate seats, torch the filibuster lock, and every future spending bill needs America-Party sign-off. Rallying the Bitcoin base—influencers, HODLer-millennials, and Silicon Valley treasurers—gives him cash, volunteers, and a meme-army no super-PAC can match. Mark Cuban and Anthony Scaramucci are already circling.
The Contrarian Caveats
- Volatility Tax: Asking swing-state retirees to park savings in a 70 vol asset is a hard sell if BTC revisits $80 k.
- Reg-Risk: A pro-Bitcoin party invites scrutiny from an SEC still suing exchanges like it’s on commission.
- Tesla Distraction: Wall St. analysts downgraded TSLA this week, fretting that Musk is adding “political hobbyist” to his 17-item job description.
Elon Musk just stapled Bitcoin to a political manifesto, framing it as the monetary antidote to bipartisan debt addiction. Love him or loathe him, the move forces U.S. voters—and every candidate in 2026—to pick a side in the fiat-versus-finite debate. For investors, it’s one more structural tailwind in a year already stacked with ETF inflows, supply shocks, and trillion-dollar deficits. If you believe Musk’s track record of dragging fringe tech into the mainstream, front-running the America Party’s orange wave might be the most American trade you can make. Yes indeed, it might be the right time to buy Bitcoin.
]]>

With momentum building gradually, analysts have identified critical thresholds that could determine whether FLOKI continues upward or re-enters a bearish channel. At the time of writing, FLOKI is trading at approximately $0.00007471.
Technical Setup Suggests Building Momentum Above Key Support
A recent post by analyst Artyom (@art_the_trader) outlines a bullish scenario developing on both the weekly and daily charts for FLOKI/USDT. The weekly structure remains intact, with the price holding above the June low and consolidating within a broader recovery formation.
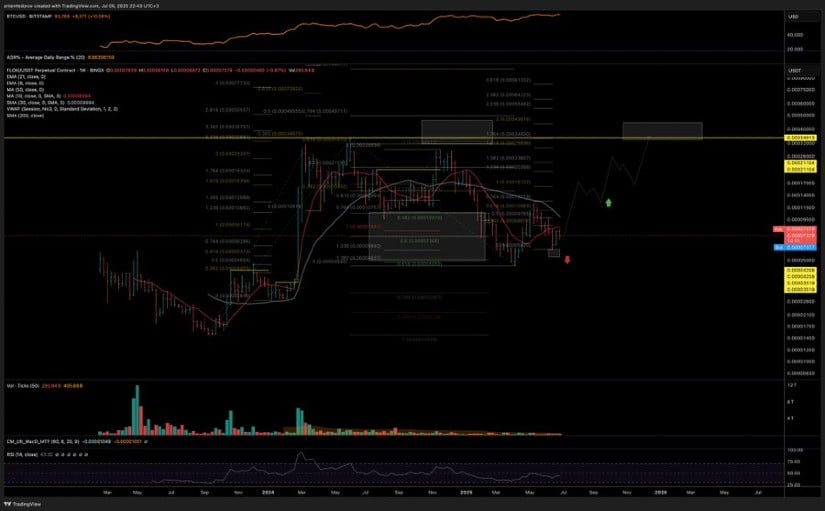
Source: X
Fibonacci retracement levels point to $0.00002554 and $0.00003652 as potential targets if current support continues to hold. The base near $0.00000950, which historically attracted strong accumulation, reinforces the validity of the setup.
The daily timeframe supports this broader view, showing FLOKI maintaining its structure above July’s lows and trading above the 50-day moving average. A recent break of a descending trendline has opened room for short-term movement toward $0.00001160 and $0.00001460.
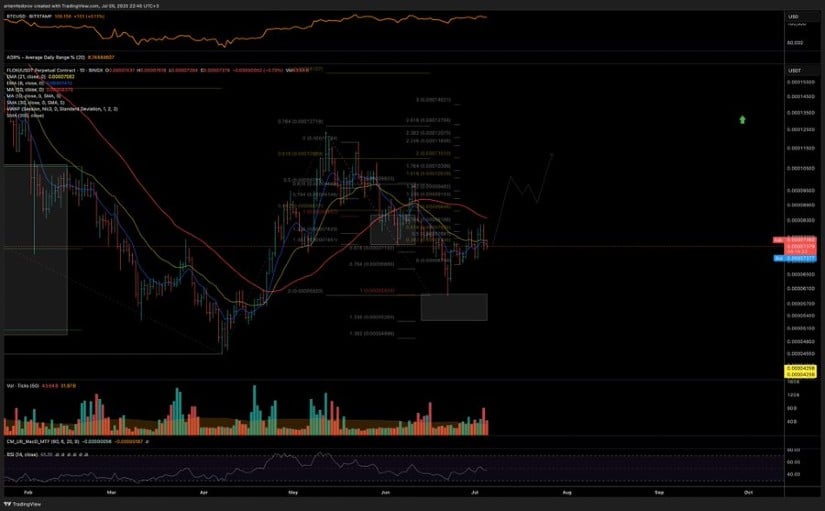
Source: X
The RSI has stabilized in the 45–50 range, while daily volumes have increased slightly during green candle formations. These signals indicate cautious optimism among buyers, although a breakout above $0.00001040 is required to confirm further upside.
Price Volatility Persists Amid Declining Intraday Volume
The 24-hour chart shows price fluctuations within a narrow range. FLOKI touched a daily high of $0.00007650 before retracing to a low near $0.00007300, closing the session at $0.00007410. This represents a 4.27% intraday decline, reflecting ongoing pressure from sellers at local resistance levels. Despite these movements, support near $0.00007300 remains unbroken, suggesting the area continues to attract defensive buying interest.
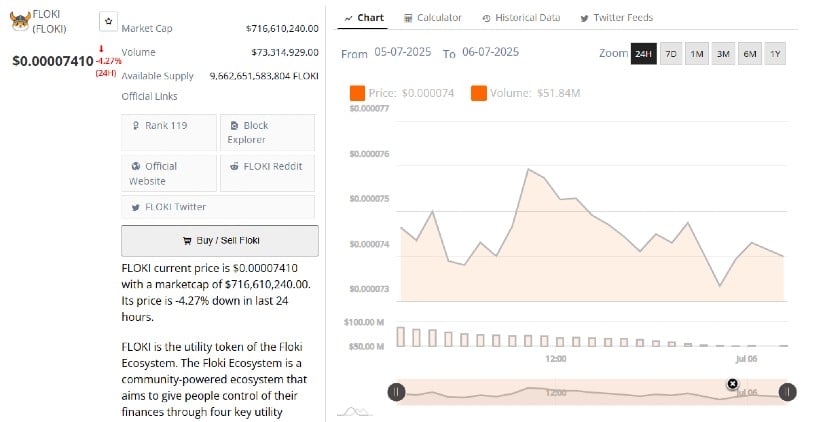
Source: BraveNewCoin
Volume activity offers additional insight into trader sentiment. The 24-hour trading volume stood at $51.84 million, down from $73.3 million the previous day. This reduction highlights waning activity, especially during recovery attempts, indicating that some market participants remain on the sidelines.
With FLOKI’s market capitalization at $716.6 million and a circulating supply of 9.66 trillion tokens, the token holds its rank at 119 across cryptocurrencies. However, to shift sentiment decisively, the market will need a spike in volume alongside a move above immediate resistance zones.
Indicators Signal Early Reversal Signs Amid Sideways Structure
From a daily technical perspective, FLOKI is consolidating near short-term support after an extended downtrend. The RSI currently reads 47.74 and is trending slightly above its moving average, indicating a mild bullish divergence. Should the RSI rise above 50 and maintain that position, it would strengthen the argument for a breakout toward $0.00010000 in the coming days.
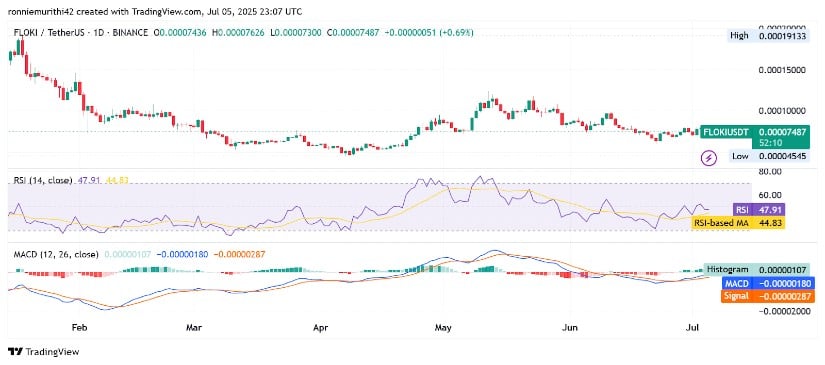
Source: TradingView
The MACD indicator also supports the possibility of a trend reversal. The MACD line at -0.00000181 is converging toward the signal line, with the histogram recently turning positive. These early crossover signals imply momentum may be shifting, but confirmation depends on stronger follow-through from buyers.
Without additional volume and a sustained breakout from the current consolidation band, FLOKI remains in a neutral-to-bullish state. The $0.00000750–$0.00000800 zone remains a critical support to watch in case of renewed downside pressure.
]]>
Lobbyists for the “number-go-up” crowd had prayed for friendly language on airdrops, staking, and that annoying double tax on miners. Senator Cynthia Lummis even tried a hail-Mary amendment to stop miners being taxed twice (block reward and sale). All of it died on the cutting-room floor.
Why Bitcoin still wins
Here’s the kicker: the bill’s very awfulness is still rocket fuel for scarce, censorship-resistant assets such as Bitcoin.
- Debt spiral economics – A $5 trillion bump to the debt ceiling all but guarantees more Treasury issuance. History says politicians won’t match that with spending cuts; they’ll print. Debasement is bullish for hard-capped assets: there will never be more than 21 million BTC.
- Inflation hedging déjà vu – Gold and oil spiked within hours of the vote; Bitcoin tagged $109,000 and change. Nigel Green of deVere notes investors are “running for anything that can’t be printed.”
- 2024 halving tailwind – Supply growth has already been cut to ~0.8% a year. Add ETF inflows, corporate balance-sheet FOMO, and now a fiscal free-for-all: the demand/supply mismatch looks cartoonish.
Put bluntly, it is likely that now is a good time to buy Bitcoin, because macro policy just told you it doesn’t care about the dollar’s purchasing power. In fact, Bitcoin quietly moved up on Sunday night to above $109,000. It’s just a 3% move away from a new Bitcoin all time high. So the long-awaited Bitcoin price predictions that suggested $200,000 was a realistic target for 2025 may yet prove to have been right all along,
Bitcoin looks strong and ready to tackle a new all-time high, source: BNC Bitcoin Liquid Index
The moral math nobody wants to do
Sure, the bill hands millionaires a 3 % after-tax bump, lifts SALT deductions four-fold for the upper-middle class, and juices estate-tax exemptions to $15 million. It funds that largesse by hacking at Medicaid and SNAP while slapping 20-30 % tariffs on allies. Even mainstream economists are calling it a “permanent re-ordering of the trade and spending model.”
That sounds grim—unless you’re parking value in an asset outside the monetary blast radius. More debt → higher inflation expectations → higher real-asset multiples. Bitcoin was built for exactly this scenario.
Washington’s Crypto Week consolation prize
The Hill hasn’t forgotten digital assets entirely. Lummis is already back with a standalone mining-tax fix and a $300 de minimis exemption for everyday crypto spend. Meanwhile, House GOP leadership has dubbed the week of July 14 “Crypto Week,” aiming to pass:
- CLARITY Act – the long-delayed regulatory framework;
- Anti-CBDC Surveillance State Act – kills any Fed-issued digi-dollar;
- GENIUS Act – stablecoin rulebook.
If those land, regulatory overhang evaporates just as fiscal madness peaks. That combo could make today’s price look quaint. Bitcoin tends to outperform other asset classes, so it simply doesn’t make sense to bet against Bitcoin.

Never bet against Bitcoin, Source: Case for Bitcoin
Three contrarian reasons to stack sats right now
| Macro trigger | Why it matters for BTC | What the skeptics miss |
| Debt-to-GDP on track to breach 140% by 2028 | Hard-cap scarcity narrative, institutional treasury demand | Fiat alternatives aren’t scarce; BTC is. |
| Tariff shock + supply-chain redirection | Imported-goods inflation → real-yield repression | Rate hikes can’t fix tariff-driven CPI; debasement will. |
| High-net-worth tax giveaways | Wealthy Americans get extra dry powder | They’re already crypto-curious and tax-efficient. |
Add them up and the risk/reward skews violently positive. This isn’t “number go up” euphoria; it’s macro math.
The caveats — Manage your risk
- Volatility is the entrance fee. A 30 % drawdown is still possible.
- Congress might rediscover fiscal prudence (lol) — in which case gold and BTC both cool off.
- Regulatory rug pulls remain possible, though less likely with a pro-crypto GOP House/Senate.
Trump’s Big Beautiful Bill is a fiscal sugar high that may leave Main Street with a hangover—but it gifts Bitcoin a “perfect storm” narrative: soaring debt, entrenched inflation, and zero political will to stop printing. If you’ve ever asked when is the best time to invest in Bitcoin, the market just flashed a neon sign: now is a good time to buy Bitcoin.
]]>

“Today, the America Party is formed to give you back your freedom. By a factor of 2-to-1 you want a new political party, and you shall have it! When it comes to bankrupting our country with waste & graft, we live in a one-party system, not a democracy.”
With that, the world’s richest man—freshly excommunicated from Team Trump—pledged to bulldoze the 169-year-old duopoly that has run America since the telegraph was “cutting-edge.” He’s calling it the America Party.
From first buddy to sworn enemy
Only eight months ago Musk was basically Trump’s Minister of Cool: dancing at rallies, parking a four-year-old “Little X” on the Oval Office rug, and bankrolling the campaign to the tune of $277 million.
Trump rewarded him with the jokey-sounding but terrifyingly real Department of Government Efficiency—“Doge.” Musk slashed 20 percent of federal headcount, bragged about “saving $190 billion,” and promptly triggered a Congressional Budget Office report suggesting his cuts cost taxpayers $135 billion in knock-on chaos.
The bromance imploded in May when Musk quit Doge and torched Trump’s so-called “Big, Beautiful Bill,” a deficit-ballooning tax-and-spend monster projected to add $3 trillion over ten years. Trump signed it anyway on July 4, draping himself in fireworks and fiscal denial.
Cue Musk’s poll the next morning: “Should we create the America Party?” 1.25 million users clicked—65 percent said yes. Twenty-four hours later, the party sprang fully formed from the billionaire’s keyboard like Athena from Zeus’s skull.

Trump, posting on Truth Social, is no longer Elon Musk’s biggest fan
A party of one (for now)
Important caveat: as of this writing no paperwork has hit the Federal Election Commission-otron. Until Musk spends or raises more than $5,000 for a federal race, America Party is just an edgy Twitter handle.
Also, Musk can’t run for president—South African birth certificate, sorry birther movement—but he hasn’t named a figurehead either. Early fan fiction touts Mark Cuban, Andrew Yang, or (because the timeline is weird) Anthony “the Mooch” Scaramucci.
The micro-target strategy
Musk’s own white-paper tweet sketches a sniper, not a steamroller:
“Laser-focus on just 2 or 3 Senate seats and 8-10 House districts. Given razor-thin margins, that’s enough to be the deciding vote.”
Translation: don’t bother cracking California; flip a couple of evenly matched suburbs in Pennsylvania and Arizona, hold Congress hostage, and extract whatever fiscal-hawk concessions tickle your spreadsheets.
Can it work?
Third parties in the U.S. are where idealism goes to die:
| Year | Outsider | National vote share | Lasting impact |
| 1912 | Teddy Roosevelt’s Bull Moose | 27% | Handed the White House to Woodrow Wilson |
| 1992 | Ross Perot’s Reform | 19% | Zero electoral votes, Clinton wins |
| 2016-24 | Libertarians/Greens/etc. | <4% | Mostly spoiler headlines |
Musk, though, isn’t starting penniless. He has (a) the deepest pockets on Earth, (b) a built-in marketing machine in X, and (c) an ideological hook—anti-graft techno-populism—that polls well among under-40 independents. Still, ballot-access law is a 50-state Hunger Games. Ask Andrew Yang’s Forward Party how many weekends it took just to hire signature-gatherers.
Subsidies, swords, and hypocrisy
Irony klaxon: Musk rails against “bankrupting waste,” yet Tesla gleaned $7.7 billion in U.S. EV tax credits and regulatory credits between 2010-24, while SpaceX counts NASA and DoD as core customers. Trump—never one to miss a hypocrisy grenade—threatened to sic Doge auditors on those subsidies: “Without subsidies, Elon would probably have to close up shop and head back to South Africa.”
That’s theater, sure, but Tesla’s share price whipsawed 8 percent in after-hours trading the moment Musk hit “post,” and Azoria Partners froze a planned Tesla ETF listing pending “political clarity.” Investors hate policy risk even more than they hate flaky Autopilot software.
Meanwhile, Trump’s bill was passed last week, but with no red meat for the supportive crypto industry. Even so, Now for the juicy bit: even though Washington’s “One Big Beautiful Bill Act” (OBBBA) never utters the word crypto, markets think Congress just gift-wrapped Bitcoin a bull case the size of the Rose Garden. Buried inside the 2,300-page monster lies an unfunded $3.3 trillion splurge of tax breaks and giveaways that the Congressional Budget Office says will balloon the deficit through 2034—essentially strapping a jet-pack to the national debt.
Fiscal hawks are screeching, but currency traders have already voted with their feet: the U.S. Dollar Index has cratered 10.8 percent in the first half of 2025—its ugliest start to a year since the post-Nixon chaos of 1973. A fresh wave of supply-side cuts plus record borrowing is a textbook recipe for bigger deficits, looser monetary policy down the road, and—if history is any guide—another bout of dollar debasement. Translation? Every greenback in your pocket just got another haircut, and the Fed hasn’t even reached for the scissors.
That’s manna for an asset capped at 21 million coins and freshly tightened by April’s halving. With Treasury issuance crowding out liquidity and BRICS+ nations experimenting with non-dollar trade, Bitcoin suddenly looks less like a speculative side-bet and more like an escape hatch from fiat-land. That’s right, if you’re been wondering if now is the right time to buy Bitcoin and crypto assets, the answer might be yes.
“This bill guarantees the fiat death spiral continues,” an institutional crypto strategist told me, requesting anonymity. “The fastest way to pump Bitcoin is for Congress to keep pretending it doesn’t exist—so thanks, I guess.”
In short, the Act’s greatest crypto clause may be the one it never wrote: a real-time reminder that scarce digital money can’t be printed at the stroke of a politician’s pen. Don’t forget, as the chart below shows, Bitcoin outperforms every other asset class.
Bitcoin price performance is strong on all timeframes, Source: Case Bitcoin
Why Elon matters more than Kanye 2020
In 2026 the Senate map is brutal for Democrats: they’re defending 23 seats to the GOP’s 10. Toss in a wild-card America Party siphoning 5-7 percent in purple states and you could see gridlock so exquisite it belongs in the Louvre.
But there’s a non-zero chance Musk’s gambit backfires Republican-spoiler style, handing Democrats a free lunch. Treasury Secretary Scott Bessent already told reporters Musk “should focus on rockets, not roll calls.”
Contrarian crystal ball
- Short-term: Expect a super-PAC blitz once FEC thresholds trigger. Look for flashy endorsements, maybe a “Mars-shot” infrastructure plank that marries deficit hawkery to hyper-tech public works.
- Medium-term: If Musk snags even two Senate kingmakers, he becomes the Joe Manchin of Silicon Valley—equal parts deal-maker and bond-market bogeyman.
- Long-term: Either the America Party morphs into a permanent libertarian-tech coalition (à la Germany’s FDP with better memes) or it dissolves the second Musk needs bipartisan subsidies for Starlink 2.0.
The bottom line
Elon just swapped flame-throwers for filibusters. Whether the America Party is a disruptive upgrade or software vaporware depends on two untested propositions: Musk’s willingness to burn cash without guaranteed ROI, and voters’ appetite for a CEO-in-chief who can’t actually run for chief.
Stay tuned, the popcorn futures market is looking bullish.
]]>

The token has been trading in a narrow range, with brief surges quickly met by resistance, keeping upside potential limited. As of July 6, 2025, HBAR is hovering near the $0.154 mark as traders assess whether recent bullish attempts can break through the $0.160 resistance level.
Market data suggests a neutral stance, with volume, momentum indicators, and open interest reflecting a cautious outlook.
Intraday Bounce Fails to Sustain as Volume Weakens
The 24-hour trading session from July 5 to July 6 began with modest optimism. HBAR climbed from approximately $0.152 to over $0.155 by mid-session, showing temporary strength as short-term buyers returned. However, the upward movement lacked intensity and failed to sustain above the short-term resistance of $0.1555. The price pulled back by the end of the day, closing at $0.153071, and indicating a reassertion of selling pressure.
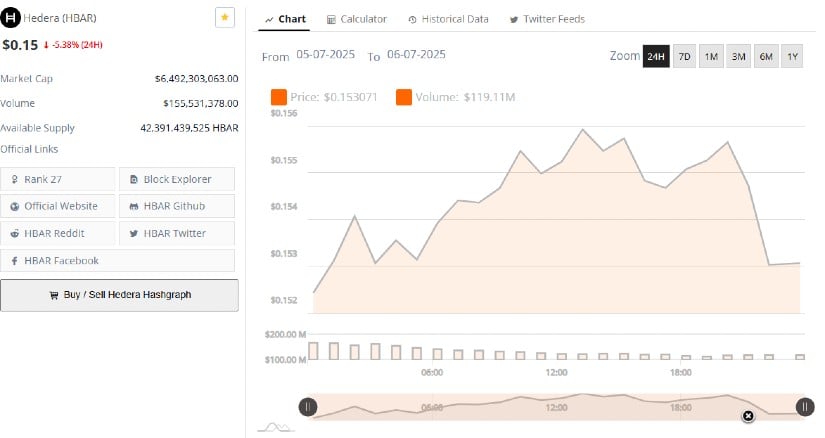
Source: BraveNewCoin
Trading volume supports this reversal. The total volume reached $119.11 million, down significantly from the previous session’s $162 million. This decline suggests limited follow-through from market participants, even as the price attempted to rise.
Without a strong volume to support continued upward movement, the rally lost momentum quickly. The current market cap remains at $6.49 billion, positioning Hedera at rank 27, but further gains may be limited without improved market participation.
Short-Term Price Action Stalls Below Resistance
On the 1-hour chart, HBAR has been consolidating in a tight range between $0.152 and $0.156 following a sharp rally from below $0.145 to a high near $0.164. The current sideways movement reflects uncertainty, with the recent correction halting the bullish continuation.
Price action has flattened, suggesting that buyers and sellers are reaching a temporary equilibrium. Bulls must reclaim control above $0.156 to shift market sentiment in their favor.
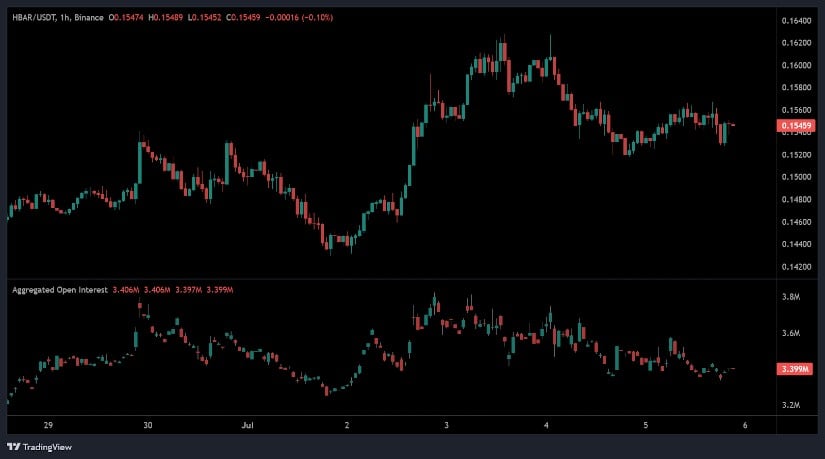
Source: Open Interest
Supporting this view, open interest (OI) peaked at over 3.8 million contracts during the June 30 price rally. Since then, OI has gradually declined, now sitting at approximately 3.399 million. The decline indicates that traders closed positions during the correction, often a signal of caution or lack of conviction. Without a rebound in OI and price, HBAR risks slipping below $0.152, potentially triggering further losses toward $0.148.
Indicators Suggest Recovery Attempts Are Still Fragile
The daily chart shows HBAR posting a modest gain of 1.14%, closing at $0.15482. This green candle approaches the upper boundary of the Bollinger Bands, but the token remains below the 20-day Simple Moving Average (SMA) at $0.16069. That SMA currently acts as the key resistance level for any extended recovery.
If broken, it may pave the way toward higher zones around $0.17 to $0.18. However, failure to breach this level may result in renewed pressure toward $0.148 or the lower Bollinger Band at $0.13697.
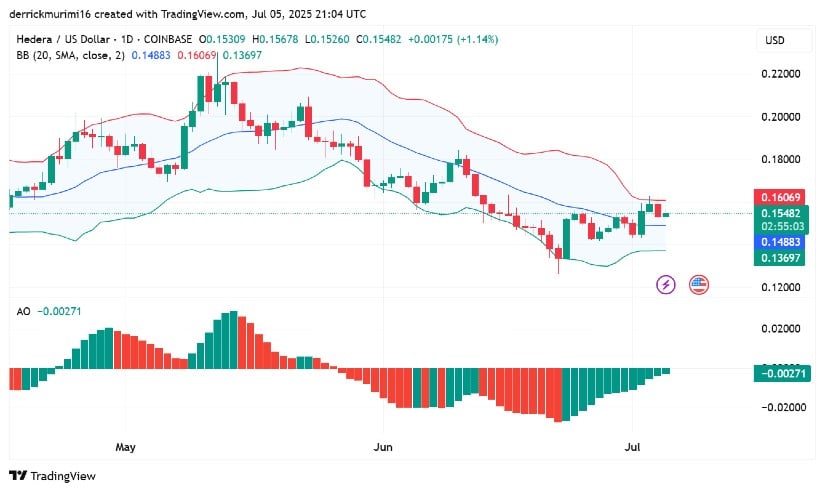
Source: TradingView
Momentum indicators remain neutral. The Awesome Oscillator (AO) shows a slight improvement with green histogram bars forming, but the AO remains below the zero line at -0.00271. This suggests bearish momentum is fading, though not yet reversed.
A confirmed bullish trend would require AO to cross above zero alongside increasing price action. Until such confirmation appears, HBAR’s trend remains range-bound with modest upside attempts amid weak participation.
]]>
Market participants are closely observing whether BNB can sustain its push above the $654 neckline, a move that could signal the start of a broader recovery. The asset’s performance over the next few sessions may determine if bulls have enough strength to challenge the $667 resistance zone.
Bullish Reversal Pattern Strengthens Near Key Support Zone
A recent technical formation observed on the BNB/USDT chart has gained traction following a strong rebound from the $652 support level. As identified by a prominent trader Rai, a double bottom pattern has emerged with two distinct lows followed by a break above the neckline at approximately $654.
This W-shaped structure typically suggests a potential trend reversal when backed by volume and disciplined stop-loss placement. The ongoing price action has respected the pattern, with bulls attempting to confirm the breakout zone near $654.27.
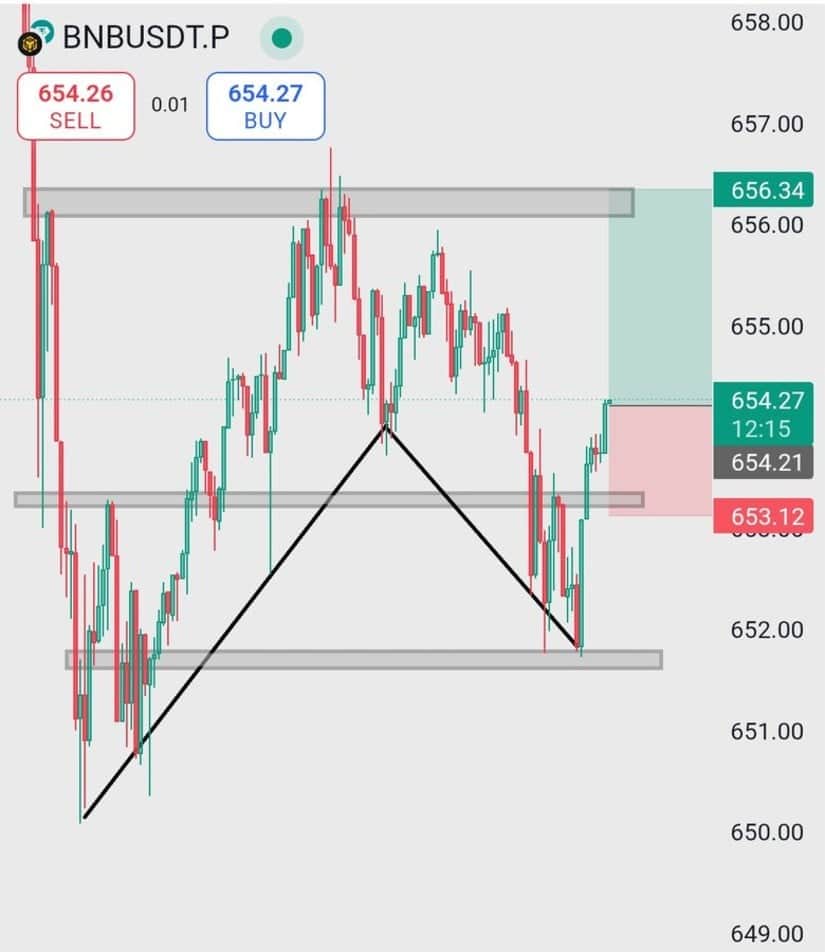
Source: X
Traders have marked the immediate upside target at $656.34, positioning stop-losses slightly below the recent low at $653.12. The risk-to-reward profile remains tight, offering a controlled setup for short-term participants.
The price has already tested the neckline area post-breakout, which could serve as a retest confirmation if momentum builds. Sustained interest from breakout traders may push the price toward the projected target, especially if the setup remains intact during the next intraday sessions.
Short-Term Volatility Hints at Market Caution
Over the past 24 hours, Binance Coin has traded within a relatively narrow band, closing the session at $654.54 with a minor decline of 1.34%. Despite reaching highs near $656.50, the asset experienced multiple short dips below $653 before regaining ground.
The session’s price behavior reflects short-term indecision, with buyers unable to force a sustained breakout above resistance. A minor intraday double top pattern also emerged during the trading day, reinforcing the presence of overhead selling interest near the $656–$657 zone.
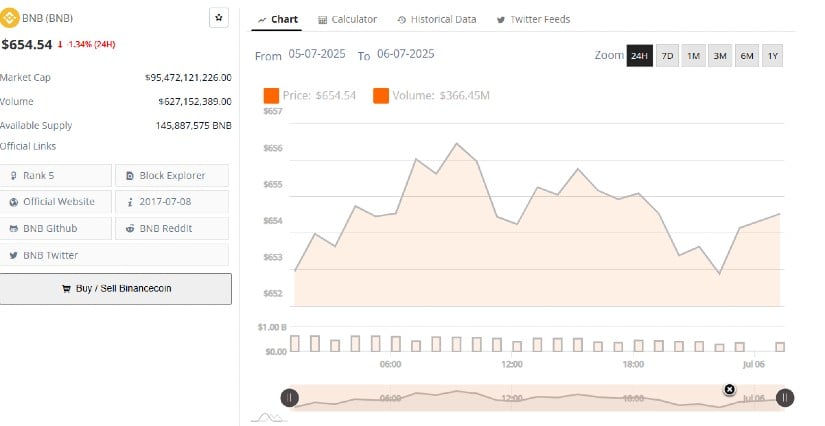
Source: BraveNewCoin
Volume dynamics remain mixed. The total daily trading volume stood at $627.15 million, while session-specific flow came in at $366.45 million, implying stronger activity earlier in the day that tapered off later. The narrowing trading range and muted follow-through on rebounds suggest that traders are waiting for confirmation before increasing exposure.
A strong close above $657, supported by renewed volume, would be needed to shift the market bias more decisively in favor of bulls. Until then, price may fluctuate near its support zones between $652 and $654.
Momentum Builds as Indicators Signal Recovery Potential
On the other hand, BNB is currently trading at $655.77, showing marginal upward pressure. The daily chart places the asset near the upper boundary of the Bollinger Bands, which are beginning to widen.
The upper band sits at $667.34—a key level that aligns with the next resistance target should current momentum persist. Meanwhile, the 20-day simple moving average, located at $646.61, continues to act as dynamic support, confirming the $646–$648 area as a buyer defense zone.
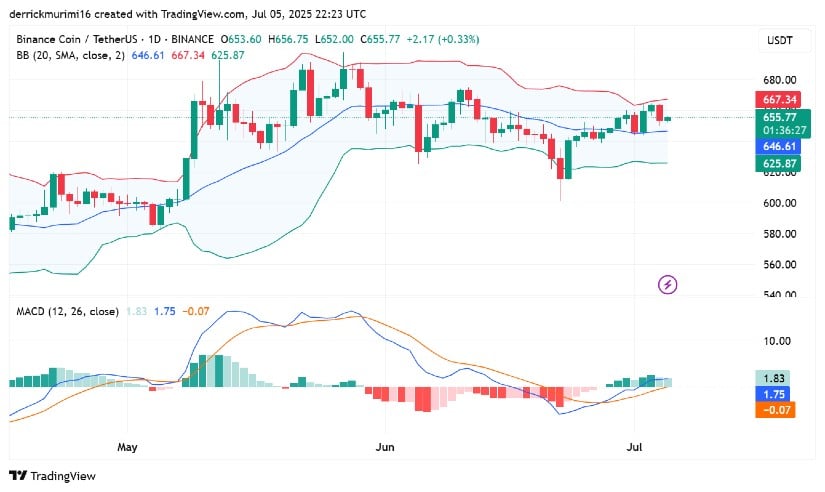
Source: TradingView
Momentum indicators are beginning to align with bullish potential. The Moving Average Convergence Divergence (MACD) shows the MACD line crossing above the signal line, while the histogram has moved into green territory. Although the MACD remains below the zero line, this early crossover suggests that bearish momentum is weakening.
A continued climb above $667 could extend the upside toward $680, particularly if market conditions remain stable and volume supports the move. If price stalls, however, traders may revisit support near $646 to reassess short-term positioning.
]]>
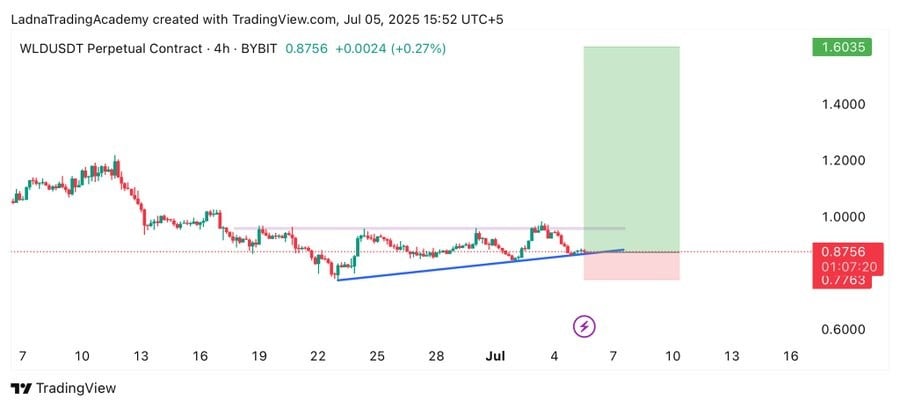
Worldcoin (WLD) is currently trading at a critical inflection point, supported by the formation of a key technical structure. With price action compressing against horizontal resistance and the lower trendline holding firm, traders are closely monitoring WLD for a breakout confirmation.
Ascending Structure Signals Compressed Momentum
A recent post by analyst @JamesBitunix from USA Signal outlines an ascending triangle developing on the 4-hour WLD/USDT chart. This pattern reflects a series of higher lows pressing against a horizontal resistance between $0.95 and $1.00.
The price has tested this level multiple times without a confirmed breakout, suggesting that supply at this zone remains strong, but so does the demand supporting each dip. Most recently, WLD retested its ascending trendline support near $0.875, validating it as a key level for short-term buyers.
Source: X
Currently, the asset trades at $0.8756, sitting directly on this rising support zone. A successful defense of this level and breakout above the horizontal resistance could activate the measured move projection.
The pattern’s height suggests a potential upside toward $1.60, representing a target range if bullish volume accompanies the breakout. The invalidation of this pattern would occur with a daily close below $0.86, which could shift momentum back in favor of sellers.
Short-Term Pressure and Volatility Define Market Caution
Recent 24-hour market data shows WLD experiencing a volatile session. The price briefly rose from $0.879 to $0.885 before retracing to a low near $0.863. This fluctuation was followed by a minor rebound to $0.88 by the end of the trading session. The movement indicates that sellers are active near resistance, while bulls continue to defend support, creating a narrow and reactive range.
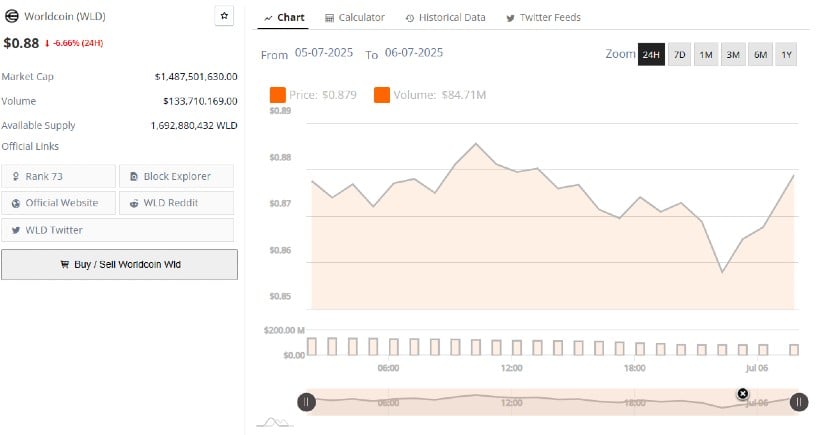
Souce: BraveNewCoin
Daily volume for the session was recorded at $84.71 million, significantly lower than the cumulative 24-hour turnover of $133.71 million. This implies that much of the activity occurred earlier in the day, followed by reduced participation in the latter half. As volume declined, bearish momentum resumed, reflected in the late-session dip.
The market capitalization fell to $1.48 billion, underlining a cautious sentiment among participants. For any bullish continuation, WLD must break and hold above $0.89 with higher volume engagement.
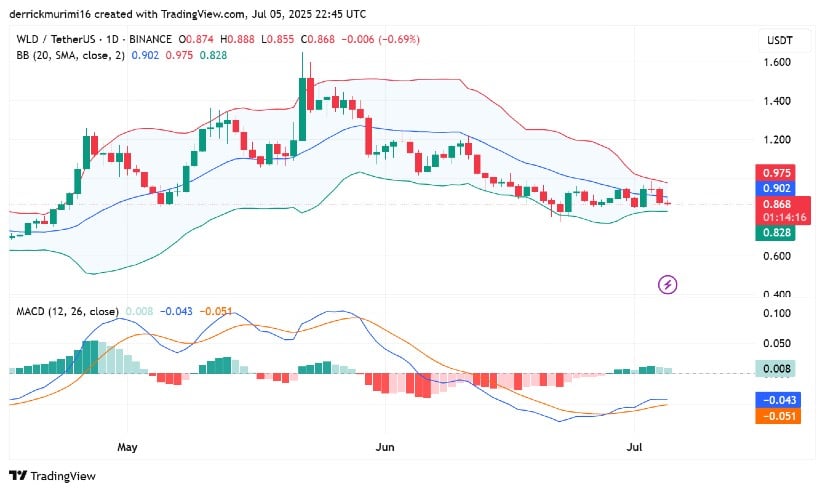
Indicators Suggest Build-Up Toward Breakout
The daily chart for WLD/USDT shows price consolidating between $0.82 and $0.90, forming a tight trading band. Bollinger Bands have narrowed, with the upper band at $0.975 and the lower at $0.828, signaling declining volatility.
This kind of price compression typically precedes an expansion phase, making the next directional move critical. WLD currently trades at $0.868, just below the 20-day simple moving average of $0.902, a key resistance level that bulls need to reclaim for continuation.
Source: TradingView
The MACD indicator remains in bearish territory, with the MACD line at -0.043 still below the signal line. However, histogram bars are light green, pointing to slowing bearish momentum. A crossover may be on the horizon if momentum picks up.
For now, price action suggests that buyers are attempting to build a base, but confirmation is required through a decisive close above the midline of the Bollinger Bands. If price fails to break out, a move back toward the $0.828 support is likely. Traders remain focused on breakout signals from this compressed range to guide their next steps.
]]>
Analysts are focusing on the $0.573 resistance level as a crucial pivot that could define OP’s short- to medium-term trajectory. As of July 6, 2025, OP is trading near $0.530, with bulls and bears battling for dominance within a narrowing volatility range.
Price Range Narrows as Market Awaits Breakout Trigger
The past 24 hours have seen OP oscillate within a tight band between $0.520 and $0.535. After beginning the session near $0.530, the token experienced several brief spikes and pullbacks, suggesting reactive trading behavior rather than sustained directional movement.
A late-session rebound helped push the price to a high of $0.536 before closing the day slightly lower. This pattern highlights increased sensitivity around the current price zone, with traders cautious ahead of any significant breakout.
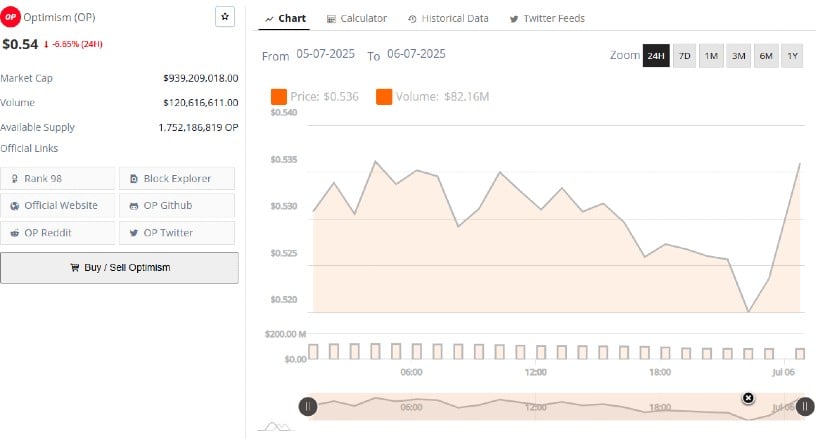
Source: BraveNewCoin
Despite the rebound, market sentiment remains subdued. Trading volume reached $120.6 million, showing moderate activity, especially during the late-day bounce. The market capitalization dropped to approximately $939 million, reflecting a 6.65% decline over the 24-hour period.
The volume uptick during the price recovery signals potential interest from buyers, although the overall structure suggests hesitation. The current range between $0.525 and $0.535 could act as a short-term consolidation area ahead of the next directional move.
Finora AI Highlights Critical Support and Resistance Zones
According to a recent chart shared by Finora AI, the $0.506–$0.460 region represents a major support zone for OP. The analysis suggests that this area is historically associated with liquidity pockets, often used by institutional players or algorithms to trigger stop-losses and gather orders.
If price action shows bullish signals—such as a bullish engulfing candle or a pin bar—within this range, it could validate a long-entry setup. The initial resistance lies at $0.573, with further targets at $0.626 and $0.689 if the recovery gains traction.

Source: X
The daily structure reveals that OP remains in a broader descending trend, dating back to its breakdown from above $3.00 earlier in the year. Attempts to climb above $0.60 have failed to hold, reinforcing the presence of a supply zone near that level.
Finora AI notes that a daily close above $0.573, followed by successful retests, would confirm a shift in market direction. On the other hand, any close below $0.460 would invalidate the current bullish setup, opening the door to potential declines toward $0.420.
Momentum Indicators Remain Weak as Price Hovers Near Bollinger Support
The daily chart of OP/USDT on TradingView shows the token consolidating near the lower boundary of its Bollinger Bands. The price closed at $0.530 after ranging between $0.519 and $0.539, remaining below the midline at $0.548. This positioning indicates that bearish momentum still holds influence, especially given the narrowing of the Bollinger Bands, which typically precedes a breakout.

Source: TradingView
The Awesome Oscillator (AO) currently reads -0.035, with recent histogram bars turning red after a brief green phase. This shift suggests that bearish momentum may be returning after a temporary pause.
A confirmed break above $0.548, paired with increasing volume, could validate bullish strength and potentially push OP toward the $0.60 mark. However, failure to hold above the $0.495–$0.50 support zone may expose the token to further downside pressure toward $0.47.
]]>
Market participants now believe Hyperliquid may be nearing a major breakout, with some calling for a move that could revisit or even exceed previous highs. This follows a strong rebound in fundamentals, as on-chain activity, revenue, and TVL all trend upward.
Fundamentals Strengthening While Hyperliquid Nears $40
Hyperliquid is hovering just under $40, about 12% below its all-time high. On the surface, price looks stable, but activity under the hood tells a different story. Hyperliquid processed over $220B in volume in the past month, now sitting at over $1.1T total. It holds a dominant 75%+ share in the decentralized perps space and is pulling in more than $1M in protocol revenue daily. That’s not just noise, it’s real usage at scale.
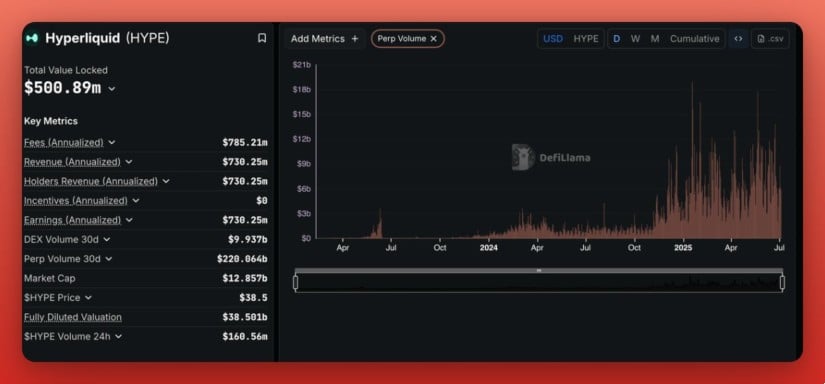
Hyperliquid processes over $220B monthly volume as TVL surges past $1.8B, highlighting rapid ecosystem growth. Source: JefferyCrypt via X.
JefferyCrypt believes the ecosystem is expanding fast, and that’s likely to start showing up in price. TVL has grown from $330M to $1.8B in three months, and $4B has been bridged into the network.
Breakout Imminent as Hyperliquid Establishes a Symmetrical Triangle
After weeks of steady sideways price action, the Hyperliquid price is now establishing a symmetrical triangle pattern. Crypto analyst Callum shows the structure has tightened to a point where breakout pressure is starting to get imminent. Price is hovering around $38.94, just under the $40 mark.
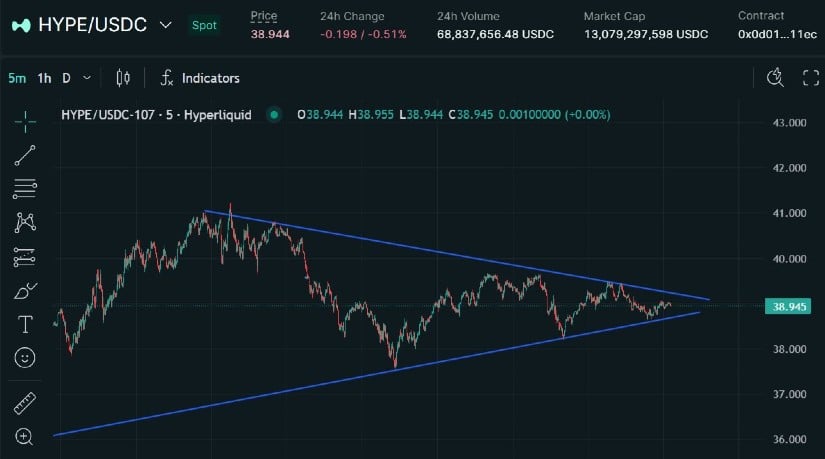
Hyperliquid forms a symmetrical triangle just below $40, with breakout pressure building near key resistance. Source: Callum via X.
The fundamentals have already laid a strong foundation, volume, TVL, and ecosystem metrics are trending up. If buyers step in and push HYPE through the $40 to $41 resistance zone, there’s room to extend toward previous highs and potentially price discovery.
HYPE Liquidity Map Tilts the Odds Toward the Upside
Analyst Ian Alloway has positioned with clear upside expectations, and the data is backing his move. The latest heatmap reveals a tight cluster of short liquidations at $41.70 worth $897K, followed closely by another $716K at $41.85. These are major liquidity clusters, right where the resistance is holding.
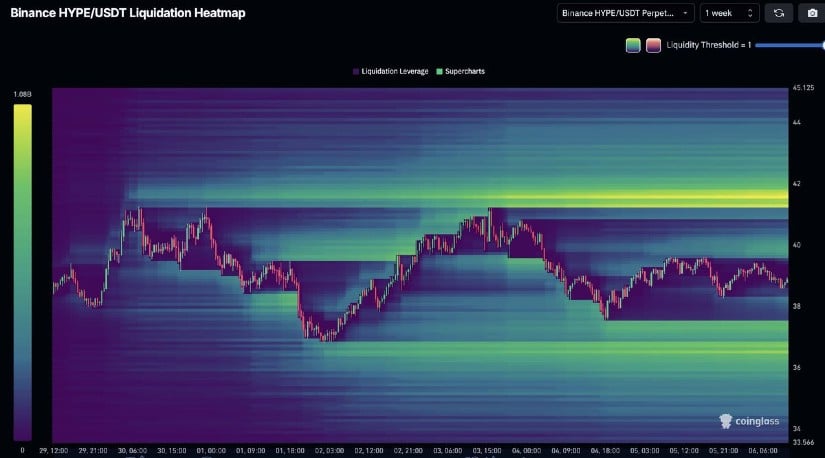
Liquidity clusters at $41.70 and $41.85 signal potential for a rapid upside move as short positions pile up. Source: Ian Alloway via X.
Clusters of short liquidations with this magnitude often become an area of interest. Once price starts moving toward them, it can trigger a chain reaction of forced exits, panic short coverings that send price jumping in a blink. And right now, the path above $41 looks like it’s been quietly prepped for exactly that.
HYPE MACD Flashes First Sign of Caution
As momentum builds around the $41 resistance zone, not everyone is leaning fully bullish. Duo Nine highlights a fresh MACD cross on the 3-day timeframe, one that typically signals a shift in short-term momentum. The histogram is now fading after a strong run, and the MACD line has just rolled below the signal. It’s not a breakdown, but it’s enough to raise a flag of caution.
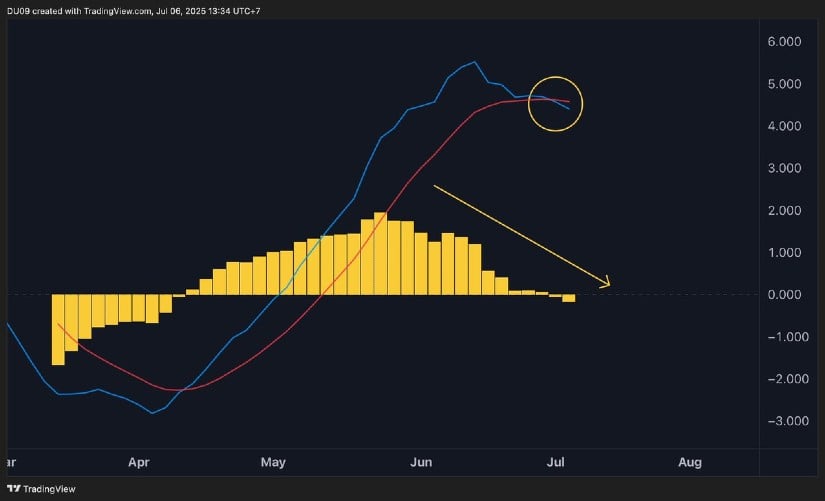
A fresh MACD cross on the 3-day chart signals cooling momentum as HYPE tests the $41 resistance. Source: Duo Nine via X.
This comes right after strong liquidity data pointed to upside potential and just as the symmetrical triangle approaches its apex. The caution here doesn’t undo the bullish setup, but it suggests the move might not be straight-line clean.
Final Thoughts: Bullish Scenario or Bearish Outlook?
While momentum appears to be building toward a breakout, Hyperliquid’s next move still hinges on key levels around $40 to $42. The technical structure is clean, liquidity zones are loaded, and fundamentals are improving across the board.
That said, with the MACD signaling a short-term cooldown, the breakout might not come as easily as bulls hope. It’s a moment of pressure building, where the next big candle could shape the short-term trend. Still, the broader picture leans bullish.
]]>
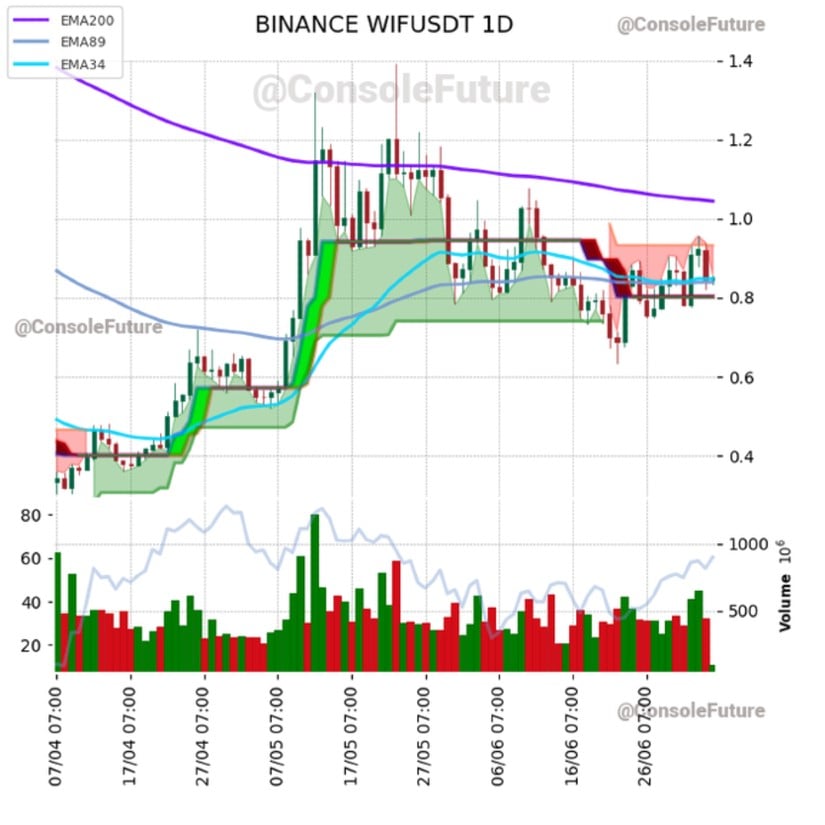
Dogwifhat (WIF) has found renewed traction as technical indicators point to a potential bullish reversal. The price remains well-supported near the $0.80 level, consolidating within a critical accumulation range. Analysts now highlight key developments that could shape the token’s next move, particularly as it approaches high-confluence resistance.
Cloud Structure Flips Bullish as Buyers Regain Ground
According to an analysis shared by Console Future (@ConsoleFuture), Dogwifhat is trading within a stable consolidation band between $0.82 and $1.00. The 1-day Ichimoku cloud has shifted from red to green, signaling a potential momentum shift if the price sustains above $0.90. This change in cloud coloration typically reflects improving sentiment and may suggest a structural setup for a trend reversal, contingent on confirmation above key moving averages.
Source: X
The token is currently holding above both the EMA34 and EMA89, indicating short-term support remains intact. However, the EMA200, located near $0.97–$1.00, still slopes downward and serves as the main barrier. A confirmed daily close above this level would be critical in validating the transition to a new uptrend. The $0.98–$1.00 region now represents a key test zone where price action will likely determine short-term direction.
Volume and Momentum Indicators Reflect Growing Accumulation
Recent 24-hour price action outlines a U-shaped intraday recovery, where WIF opened at $0.849, dipped to around $0.842, and returned to a high near $0.856 before closing at $0.85. This pattern, coupled with narrowing volatility, suggests controlled movement with modest bullish pressure. Daily trading volume reached approximately $301 million, with the heaviest activity observed during the early and mid-day trading hours.
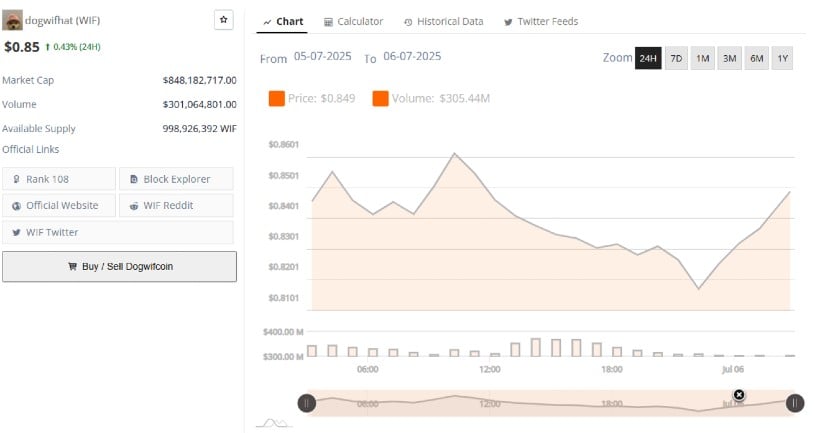
Source: BraveNewCoin
Notably, lower volume accompanied the brief pullback in the latter session, indicating that sellers lacked conviction at lower levels. This volume structure supports the interpretation of ongoing accumulation rather than distribution. Market capitalization remains steady at $848 million, with the token ranked near 108 by size. Continued price stabilization above $0.85 could allow buyers to test higher levels, including the psychological threshold at $0.90.
Key Indicators Signal Strengthening Trend Structure
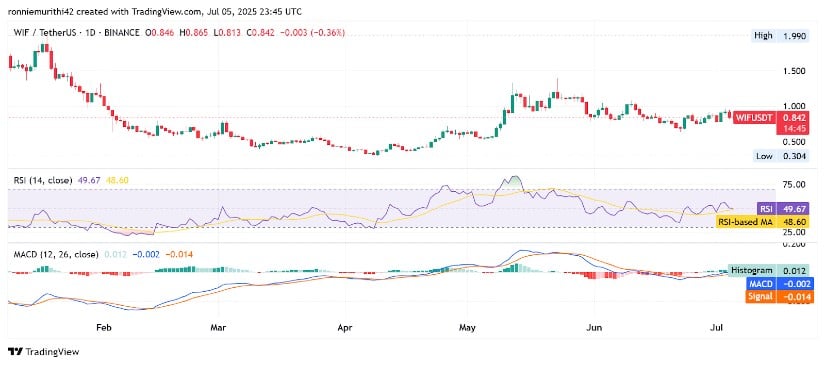
On the broader daily chart, Dogwifhat continues to form a pattern of higher lows following its pullback from the $1.00 peak in May. Support remains firm near $0.80, where prior buyer interest emerged. Price now hovers around $0.842, slightly under the session open of $0.846, maintaining a tight consolidation range. A successful breakout above $0.90 could reopen the path toward a retest of $1.00 and possibly the $1.20 extension if momentum accelerates.
Source: TradingView
Momentum indicators are beginning to confirm this setup. The Relative Strength Index (RSI) stands at 49.67 and continues to trend upward after stabilizing above 45 in mid-June. A move above the 55–60 range would likely strengthen the bullish outlook.
Meanwhile, the MACD is showing a narrowing spread between its main and signal lines, with the histogram now positive at 0.012. This crossover indicates that bearish momentum is weakening and could shift in favor of buyers if supported by an increase in volume. These technical elements suggest that a breakout could form as WIF approaches its critical resistance zone.
]]>
While Bitcoin frequently occupies the forefront of cryptocurrency discussions, a weakening trend in the U.S. dollar holds the potential to trigger profound shifts across the entire digital asset spectrum.
The symbiotic relationship between the dollar and the crypto market has become increasingly complex over the course of 2025. With Bitcoin continuing to threaten a break beyond its all time high, some analysts attribute this momentum to the ongoing “US dollar deterioration” prompting investors to look beyond conventional assets.
This shift in monetary dynamics, however, may only represent the initial phase of a far more extensive transformation poised to impact the entirety of the digital currency space.
Alternative Cryptocurrencies Primed for Significant Rallies
The sector comprising alternative cryptocurrencies – essentially all digital assets other than Bitcoin – appears strategically positioned for considerable expansion in an environment of dollar depreciation. Unlike Bitcoin, which has garnered significant acceptance among institutional players, many altcoins are still widely considered undervalued relative to their underlying technological capabilities.
The digital asset markets have seen swift evolution, with numerous alternative coins demonstrating robust performance throughout 2025. This upward trend is gaining traction as institutional capital begins to diversify beyond solely holding Bitcoin, seeking exposure to a wider array of blockchain innovations and practical use cases. Ethereum continues to maintain its leading role in smart contract functionality, while newer platforms such as Solana have attracted considerable attention due to their enhanced transaction speeds and reduced costs.
Market experts anticipate that alternative cryptocurrencies could experience disproportionately large gains during periods when the dollar is showing weakness. This phenomenon occurs because investors often perceive smaller digital assets as opportunities presenting higher risk but also potentially higher rewards. A declining dollar incentivizes investors to tolerate additional risk in pursuit of potentially superior returns.
The anticipated introduction of exchange-traded funds (ETFs) focused on altcoins could significantly amplify this pattern. Filings for financial products designed to track assets like Litecoin, XRP, Solana, and Dogecoin have emerged in 2025, potentially dramatically broadening the accessibility of crypto within traditional financial markets. These investment vehicles would offer institutional investors simplified avenues to gain exposure to alternative cryptocurrencies without the complexities of directly holding the assets. Analysts in July 2025 were giving a 95% chance of approval for Solana, XRP, and Litecoin ETFs by the SEC, with final decisions expected in October. Dogecoin, Cardano, Polkadot, and Avalanche also have high odds of approval later in the year. JPMorgan estimates that altcoin ETFs could attract over $14 billion in the first year.
Fundamental Shifts Loom for the Stablecoin Market
The stablecoin sector arguably offers the clearest illustration of the effects of dollar weakness. Stablecoins designed to maintain a peg to the U.S. dollar, such as USDC and USDT, have historically dominated this market segment. However, sustained depreciation of the dollar presents a notable challenge to their continued preeminence.
USDC has demonstrated remarkable growth, with its market capitalization increasing from $28.5 billion to $56 billion between February 2024 and February 2025. This surge has coincided with, and is likely partly driven by, the development of clearer regulatory frameworks. Circle, the issuer of USDC, secured licensing under the EU’s Markets in Crypto Assets (MiCA) regulations in July 2024, bolstering confidence in the stablecoin’s adherence to regulatory standards. By June 2025, USDC’s market cap had reached approximately 61.5 billion. Meanwhile, USDT remains the market leader with a market cap around $153-154 billion in early June 2025, though its market share saw a slight decrease.
Nevertheless, persistent dollar weakness could stimulate increased demand for stablecoins linked to other national currencies or those backed by more diversified asset portfolios. While USDC and USDT currently lead the market – with some data suggesting greater USDC usage for domestic transactions and USDT serving more as an international store of value – the competitive landscape within stablecoins could certainly transform under ongoing dollar pressure. Stablecoins have become crucial infrastructure within the crypto ecosystem, providing a fundamental layer for trading, lending, and various other financial services across the digital asset space. Any significant shift in the preferred types of stablecoins could have broad ripple effects throughout the ecosystem.
Decentralized Finance Poised for Significant Growth
Decentralized Finance (DeFi) stands out as one of the sectors most likely to experience rapid expansion during cycles of dollar weakness. DeFi protocols empower users to engage in financial activities such as lending, borrowing, and trading directly, without reliance on traditional banking intermediaries. Experts predict that DeFi could reach new heights in 2025, driven by innovation and increasing institutional interest.
The DeFi landscape has shown strong upward momentum, with various projects driving substantial changes in financial infrastructure. Leading decentralized exchanges and lending platforms have reported increased user activity as investors actively seek alternatives to conventional financial systems. The global decentralized finance market size was estimated at $32.36 billion in 2025 and is projected for significant future growth.
DeFi platforms currently offer sophisticated financial services, including perpetual trading and margin capabilities. While these platforms still navigate challenges such as fluctuating interest rates and a more limited selection of assets compared to traditional finance, they continue to innovate and attract users looking for alternatives.
The appeal of DeFi is amplified when traditional currencies face instability. These protocols operate autonomously from individual governments or central banks, making them attractive to investors concerned about currency devaluation. Dollar weakness is likely to steer additional investors toward DeFi platforms in pursuit of yield generation and more independent portfolio management. Institutional adoption of DeFi is also increasing, with institutions exploring ways to bridge traditional finance with decentralized systems.
Ecosystem-Wide Transformation
The impact of dollar weakness extends beyond individual digital currencies, influencing the entire digital asset ecosystem. This evolving dynamic simultaneously creates new opportunities and introduces fresh challenges.
Traditional financial institutions are increasingly acknowledging these shifting dynamics. Major banks and investment firms are expanding their cryptocurrency services, recognizing that digital assets may play a more significant role in investment portfolios during periods of currency uncertainty. This growing integration by traditional finance helps build new infrastructure and enhances credibility for the broader crypto sector.
The regulatory environment continues its evolution. As crypto assets gain more mainstream acceptance, regulators globally are working to establish oversight frameworks for the industry. While these frameworks can sometimes impose restrictions, regulatory clarity is generally seen as a factor that helps boost institutional investor confidence. In the U.S., the regulatory landscape remains complex, but proposals aim to clarify the roles of regulatory bodies and classify crypto assets.
International payment systems represent another area where dollar weakness could accelerate the adoption of cryptocurrencies. As the dominance of the U.S. dollar in international trade faces challenges, cryptocurrencies offer alternative solutions for conducting cross-border transactions for both businesses and individuals.
The Path Forward
The direct correlation between dollar weakness and cryptocurrency expansion may not be a permanent fixture. Market conditions are subject to rapid change, and cryptocurrency prices inherently carry high volatility. However, underlying trends suggest that the crypto ecosystem is progressively establishing greater independence from traditional financial structures.
Current structural indicators appear positive for crypto markets through mid-2025, notwithstanding the inherent volatility that necessitates careful risk management. Investors are increasingly viewing cryptocurrencies not merely as speculative ventures but as legitimate alternative assets to conventional financial products.
As the crypto ecosystem matures, the effects of dollar weakness could become even more pronounced. The convergence of increasing institutional adoption, evolving regulatory clarity, and continuous technological advancements is building a solid foundation for sustained growth across the entire digital asset landscape.
The prevailing narrative in the crypto space in 2025 extends beyond simply tracking Bitcoin’s price movements. It encompasses a more fundamental transformation of established monetary concepts, value transfer systems, and financial frameworks. While dollar weakness may serve as a significant catalyst, the ongoing evolution of the crypto ecosystem is intrinsically linked to deeper, ongoing global economic shifts that are likely to continue unfolding for years to come.
]]>
As institutional capital flows in and long-term investor confidence strengthens, Ethereum appears poised for a decisive breakout from its current range.
ETH Price Holds Steady Amid Symmetrical Triangle Setup
Ethereum price today remains largely range-bound, trading at around $2,559 on July 7, 2025. After a brief dip earlier this week toward $2,450, ETH bounced back to reclaim critical moving averages, including the 100 EMA near $2,486.
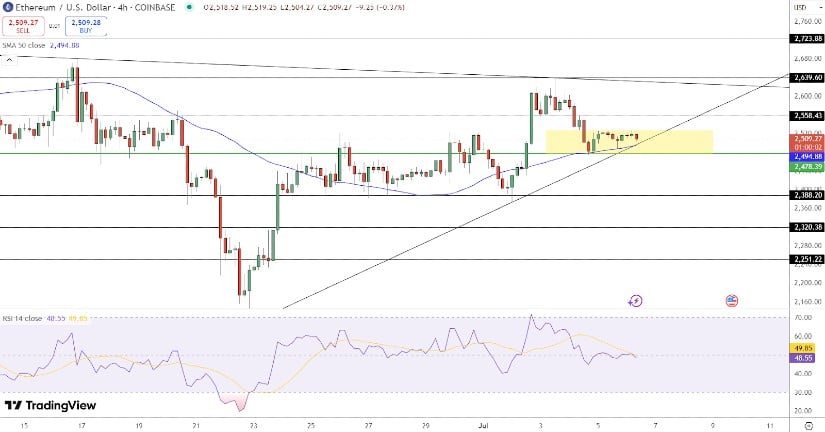
Ethereum is consolidating above $2,478 support, with a flat RSI, 50-SMA holding trend, and key breakout zone at $2,560. Source: @forex_arslan via X
According to the 4-hour chart, Ethereum is compressing within a symmetrical triangle pattern, with clear resistance near $2,560 and support around $2,478. All four key EMAs (20, 50, 100, 200) have converged within a tight band between $2,486 and $2,525—indicating that the market is nearing a critical pivot point.
The current candle structure shows reduced volatility and tightening price action, signaling a classic setup for a potential breakout. If ETH breaks above the $2,560 ceiling with volume confirmation, upside targets of $2,639 and $2,723 are likely.
However, a drop below $2,478 could invite downside risk toward $2,388 or even $2,320.
The Ethereum RSI today is hovering around 49, suggesting neutral momentum as bulls and bears battle for short-term dominance.
Ethereum ETF Inflows Signal Long-Term Institutional Confidence
Beyond the charts, Ethereum ETF news continues to strengthen ETH’s long-term bullish outlook. According to Bitwise CIO Matt Hougan, ETH ETFs could attract as much as $10 billion in inflows by the end of 2025, signaling robust institutional appetite.
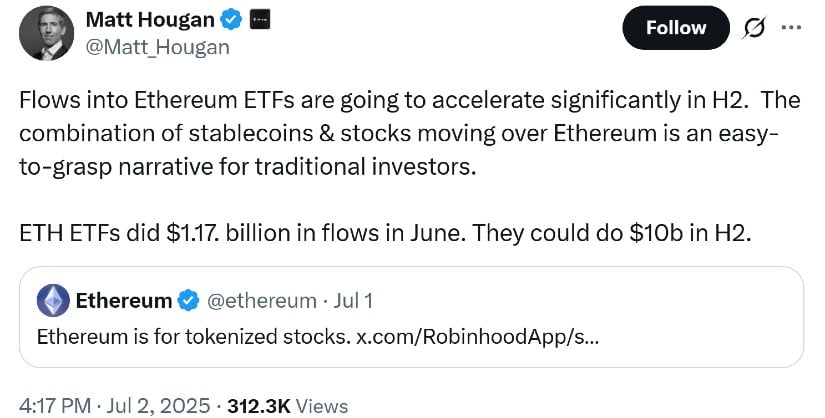
Ethereum ETF inflows hit $1.17B in June and could reach $10B in H2, driven by growing appeal among traditional investors. Source: Matt Hougan via X
So far this year, Ethereum-based ETFs have seen more than $1.5 billion in inflows, with $1.17 billion pouring in during June alone—a record month. Hougan attributes this rising interest to Ethereum’s growing role in tokenizing real-world assets like stocks, bonds, and stablecoins.
“As Ethereum increasingly becomes the settlement layer for regulated finance, traditional asset managers are taking notice,” Hougan explained. This structural evolution positions Ethereum not just as a cryptocurrency, but as an integral layer in the future of global finance.
Recent regulatory developments are also adding fuel to Ethereum’s current bullish momentum. A favorable SEC stance on crypto staking—confirming it is not classified as a securities offering—could pave the way for staking-enabled ETH ETFs, drawing in even more institutional capital hungry for yield.
Long-Term Chart Structure Points to $8,500 Target
From a macro perspective, ETH has been consolidating for over two months above the key $2,425 support level. The market has formed a rounded bottom since its April 2025 low, forming the cycle’s bottom.
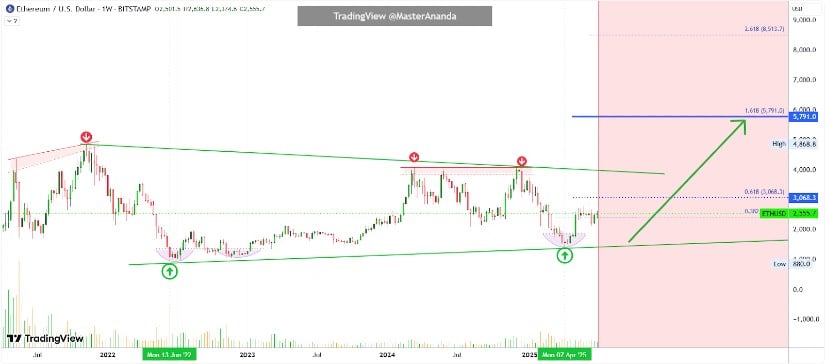
Improving fundamentals and ETF momentum support a minimum Ethereum target of $5,791, with $8,500 in play amid the 2025 bull market. Source: MasterAnanda on TradingView
“Ethereum is due for a major bullish wave,” reads one technical report, adding that $5,791 is the next logical milestone, followed by a potential rally to $8,500 by late 2025. These projections are supported by a rising long-term base and improving fundamentals—especially as the bear market that began in 2022 is now firmly behind us.
What’s particularly notable is that Ethereum hasn’t posted a new high since March 2024, but the structure of higher lows and steady accumulation suggests that a breakout is a matter of “when,” not “if.”
Ethereum Layer 2 and Ecosystem Growth Add to the Bullish Case
While the ETF narrative garners most headlines, Ethereum’s Layer 2 ecosystem continues to expand. Networks like Arbitrum, Optimism, and zkSync are helping to decouple Ethereum gas fees and boost transaction levels, making ETH more efficient and scalable for DeFi, gaming, and B2B applications.
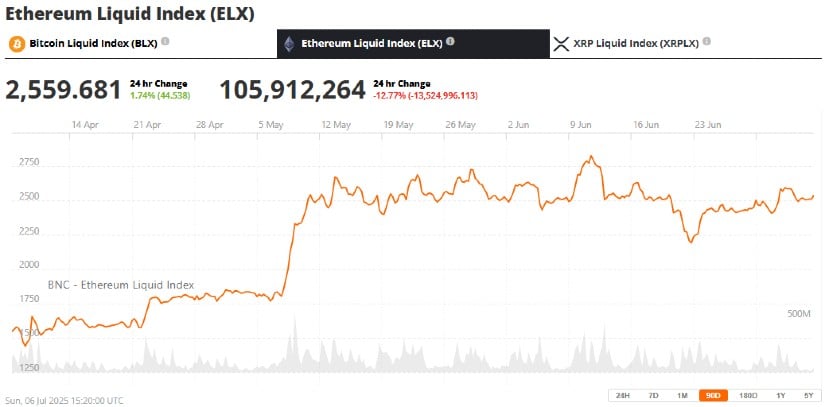
Ethereum (ETH) was trading at around $2,559.79, up 1.76% in the last 24 hours at press time. Source:Ethereum Liquid Index (ELX) viaBrave New Coin
ETH Layer 2 transaction volume remains elevated, and total value locked (TVL) on L2s has gone up steadily over the past month. Such growth for the network backs up Ethereum as a market leader in the smart contract sector.
Aside from this, Ethereum staking rewards and validator incentives have grown more attractive with recent protocol enhancements. With more staked ETH, the circulating supply is reduced, putting additional pressure on the price upwards.
Ethereum Price Outlook: Can $8,500 be a Reality?
With multiple catalysts at work—from Layer 2 growth and staking incentives to ETF momentum—Ethereum appears poised for bullish continuation. Defying the $2,560 resistance is the priority in the short term, but medium-term predictions point toward a path toward $5,791 and ultimately $8,500 by 2025’s end.
Ethereum is in a consolidation phase presently, but fundamentals are coming into place. A strong breakout would potentially start a strong trend, much like the start of previous bull cycles.
Ethereum models today increasingly indicate institutional adoption, staking mechanisms, and on-chain construction as key aspects that can drive Ethereum to its next all-time high.
]]>
Japan’s SBI Holdings moved 320 million XRP in a single transaction, sparking speculation of strategic positioning ahead of Ripple’s routine monthly release. With the unlock set to increase circulating supply, traders and analysts are watching closely for signs of institutional activity and potential market impact.
Whale Alert Flags $703M XRP Transfer
Blockchain tracking service Whale Alert first reported the transaction, noting its significant size and timing. SBI Holdings, a long-time partner of Ripple, shifted the 320 million XRP to an unknown wallet address, fueling speculation of a preemptive market strategy.

320 million XRP, worth approximately $703.5 million, was transferred between two unknown wallets. Source: Whale Alert via X
Ripple routinely unlocks 1 billion XRP at the start of each month, impacting the XRP price by expanding available liquidity. These scheduled releases are a part of Ripple’s original token distribution model and remain a major point of interest for traders and investors.
While neither Ripple nor SBI has issued public statements about the intent behind the move, analysts suggest the transfer may represent portfolio rebalancing or liquidity preparation ahead of the token release. The action aligns with typical institutional behavior, where large players adjust exposure before high-volume events to avoid price disruption or capitalize on volatility.
XRP Price Rises Despite Whale Activity
Despite the sheer size of the transfer, XRP price today remains largely unaffected. The XRP price today hits $2.25, breaking out of its recent range-bound movement between $2.10 and $2.20. This bullish breakout suggests strong market absorption of high-volume flows and potential confidence from buyers near current levels.
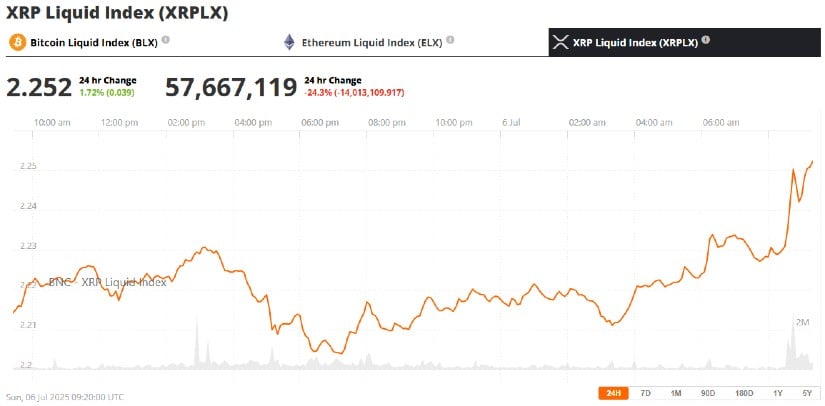
XRP was trading at around $2.252, up 1.72% in the last 24 hours at press time. Source:XRP Liquid Index (XRPLX) viaBrave New Coin
According to technical analysts, XRP is currently trading within an ascending channel, repeatedly bouncing off support and building toward resistance. This pattern, often described as a “stair-step” formation, is viewed by some traders as a precursor to breakout scenarios.
Lingrid, a prominent chart analyst, noted that XRP has respected the $2.00 support, calling it a key psychological floor that could act as a launchpad if momentum builds. “Price is coiling above a key support area. With increasing volume, XRP could retest the $2.45 resistance zone,” she stated.
This sentiment aligns with broader XRP price prediction 2025 models that anticipate gradual accumulation followed by significant upside, especially as regulatory clarity continues to emerge.
Strategic Positioning Ahead of Token Unlock
The timing of SBI’s transfer suggests more than coincidence. Large-scale moves ahead of Ripple’s monthly unlock are not unusual and often indicate institutional planning. These actions reflect calculated decisions to manage risk and liquidity or capitalize on anticipated market reactions.
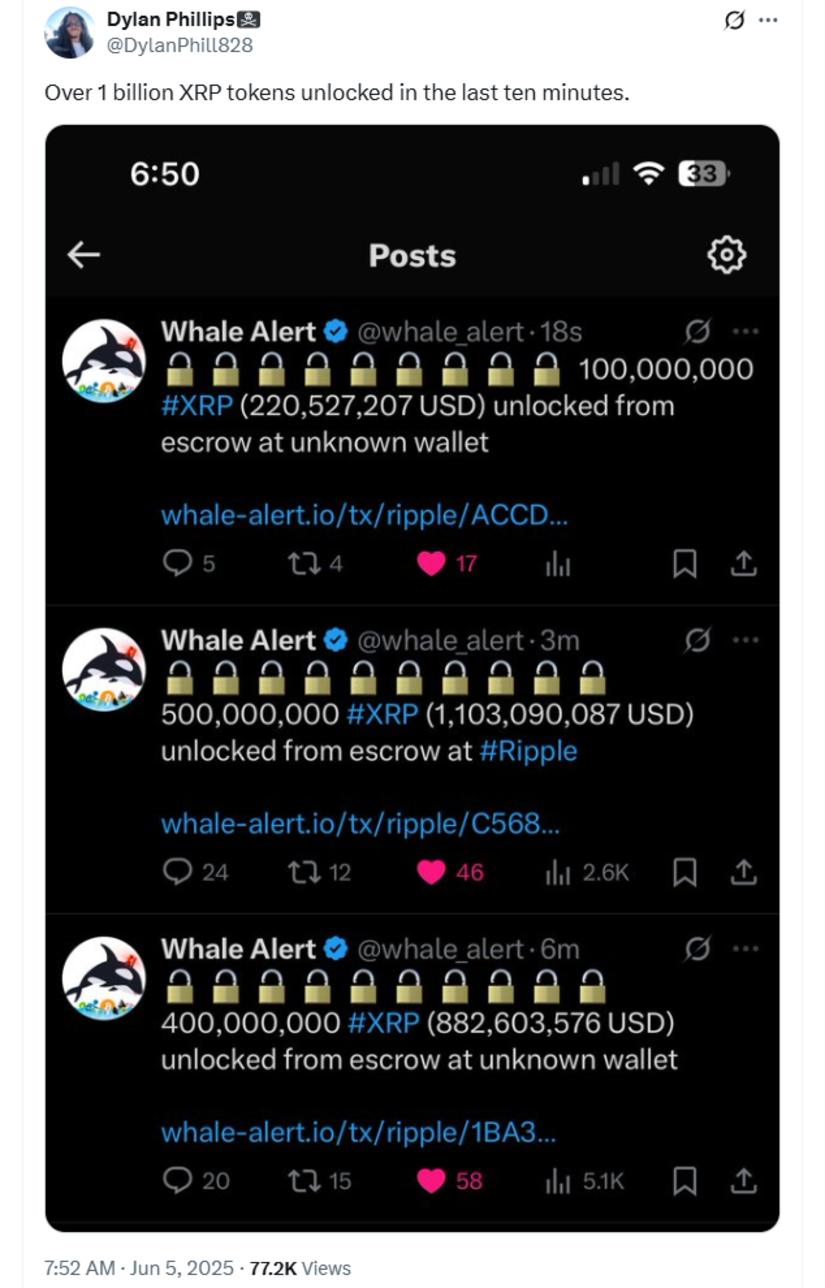
Over 1 billion XRP tokens were recently unlocked from escrow. Source: Dylan Phillips via X
In addition to the transfer, broader investor attention is shifting toward upcoming catalysts, including potential developments in the Ripple vs SEC case and ongoing speculation about a future XRP ETF. The outcome of these factors could shape future XRP predictions and institutional interest.
SEC Appeal or ETF: What’s the Next Major Catalyst?
As Ripple gears up for its next token unlock, markets are also closely watching regulatory developments. The U.S. SEC recently approved a rule change to convert the Grayscale Digital Large Cap Fund (GDLC) into a spot ETF. Notably, this fund includes Ripple XRP, bringing the token closer to entering the U.S. spot ETF market alongside Bitcoin, Ethereum, ADA, and Solana.
However, the SEC placed a temporary hold on launching the ETF, leaving the final decision in the agency’s hands. Meanwhile, some speculate that BlackRock may file for an XRP-spot ETF following a full resolution of the ongoing XRP lawsuit. The SEC’s next move—whether withdrawing its appeal or finalizing ETF approvals—could have major implications for XRP prices.
Data from Bitcoin spot ETFs show inflows of over $49.6 billion. A similar launch for XRP could inject massive liquidity and potentially trigger a new wave of institutional adoption.
Outlook: Will XRP Go Up After the Unlock?
While the XRP crypto news landscape remains active, the token’s immediate price action will likely be influenced by how the market digests the upcoming token unlock. If historical patterns hold, temporary volatility could follow, but XRP’s ability to hold above key support zones suggests underlying strength.
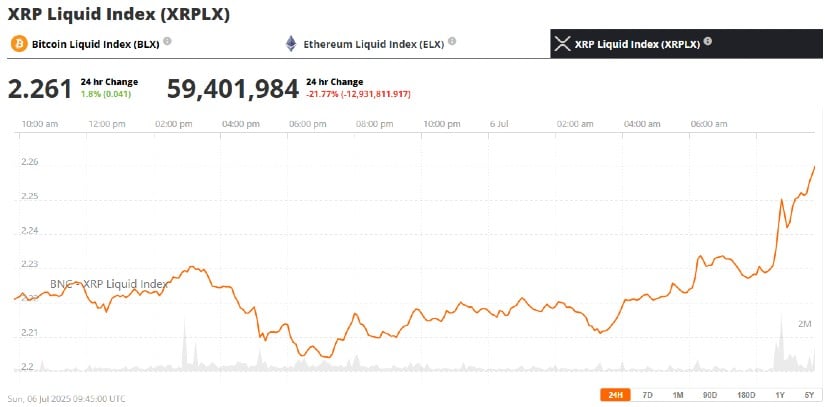
XRP was trading at around $2.26, up 1.8% in the last 24 hours at press time. Source:XRP Liquid Index (XRPLX) viaBrave New Coin
For now, XRP news today remains centered on this strategic transfer and the brewing regulatory shift. As institutions maneuver and traders watch for breakout signals, the coming days could provide a clearer direction for Ripple XRP and its future price trajectory.
Whether XRP breaks above $2.45 or dips with supply pressure, one thing is certain—Ripple crypto remains at the heart of some of the most closely watched developments in the digital asset space.
]]>
TRON has been quietly outperforming in a market that’s been tough on many altcoins this year. While other tokens struggle to keep up, TRX is holding strong, bucking the trend with impressive gains. With strong technical patterns and rising on-chain activity, TRON price prediction suggests that TRX might just be gearing up for more.
TRON Price Stays Green Despite Weak Market
TRON price may not be the loudest name in the market, but it’s quietly outperforming most altcoins in 2025. According to Dexu AI, TRX has held up remarkably well against market drawdowns, in some cases even better than BTC. This stability isn’t random; it’s largely tied to strong supply-side controls that help reduce volatility, giving TRX a lower-risk profile in shaky market conditions.
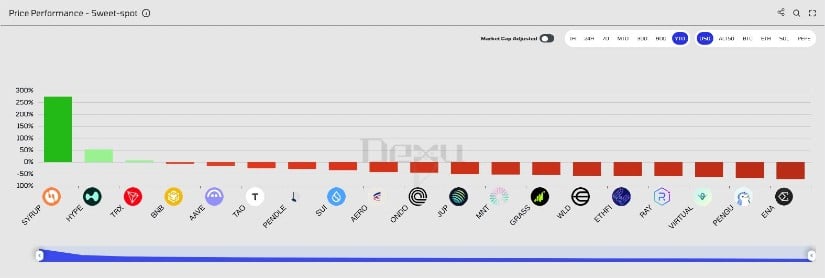
TRON outperforms many altcoins in 2025, maintaining a strong position while other tokens struggle in a weak market. Source: Dexu AI via X
The chart shared highlights how TRX has not only managed to survive but thrive in a year where many major tokens struggled. It sits in the green while much of the market is in a weak state. As TRON continues to outperform, it’s starting to catch the attention of participants looking for strength in a weak market.
TRON Monthly Chart Shows Gradual Upside
TRX is quietly carving out one of the more resilient structures in the market right now. Since marking its 2025 lows, TRX is up nearly 48%, steadily building a higher highs and higher lows formation that stands in contrast to the broader altcoin landscape. While most tokens are struggling to reclaim key levels, TRX has been grinding upward with conviction.
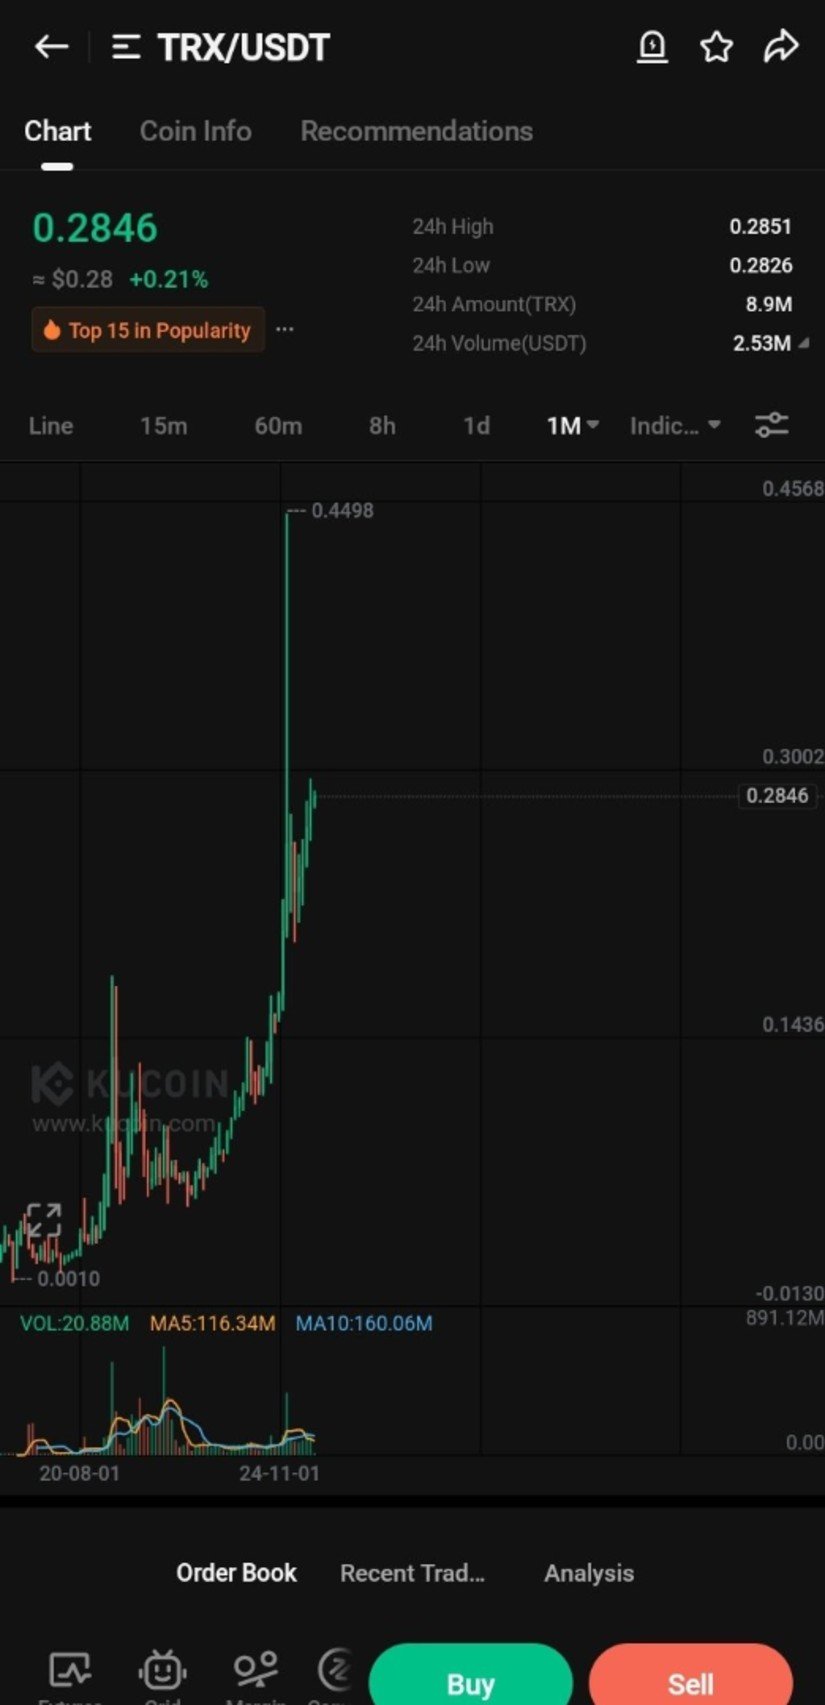
TRX steadily rises, reclaiming key resistance levels and building a resilient structure. Source: steadyfit1 via X
The monthly chart shared by steadyfit1 shows TRX TRON pushing above the $0.28 zone, reclaiming a key level that acted as resistance during its consolidation phase. The current ongoing structure remains sustainable. As long as this base holds and the trend of higher lows remains intact, TRX may be positioning itself for a slow but steady march toward $0.35 and possibly the 2024 highs around $0.44.
Cup-and-Handle Targeting $0.38
TRX Price is now hovering just above the all-time high anchored VWAP in blue, which has historically acted as a strong value zone. Holding above this level suggests buyers are in control, and if sustained, could act as a springboard for further upside. The chart shared by EasychartsTrade also shows a clear cup-and-handle pattern forming on the daily timeframe.
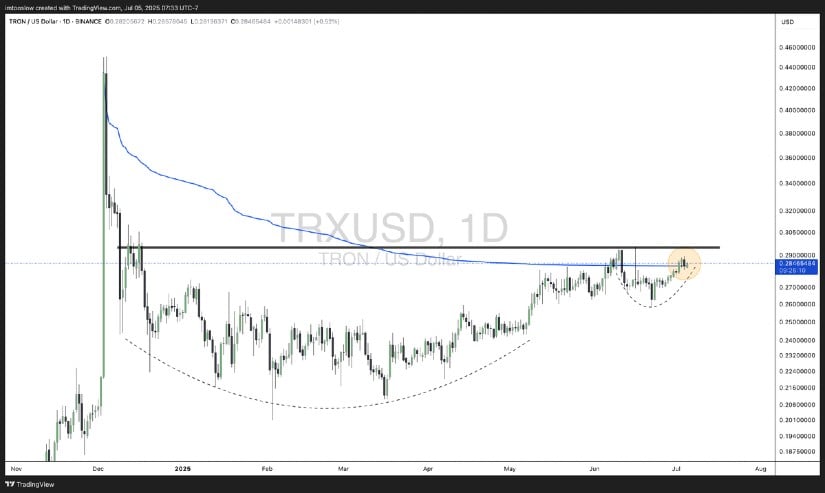
TRON forms a cup-and-handle pattern, eyeing a move towards $0.38. Source: EasychartsTrade via X
This is steady accumulation followed by a controlled pullback, exactly the kind of structure bulls want to see for continuation. TRX is pressing up against the $0.29 to $0.30 zone, and if that level gives way, it opens the door to a move towards $0.38.
TRX TRON Price Prediction: Structure Mirrors a Bullish Fractal
The side-by-side comparison from Dalin Anderson puts things into perspective. TRX’s current price action closely mirrors Bitcoin’s pre-breakout structure from years ago: slow base formation, tightening volatility, and a steady push against long-term resistance. TRX has reclaimed key levels above $0.25 and is now testing the $0.28 zone, which previously acted as a rejection point. If that area flips into support, it could set the stage for an extended move higher.
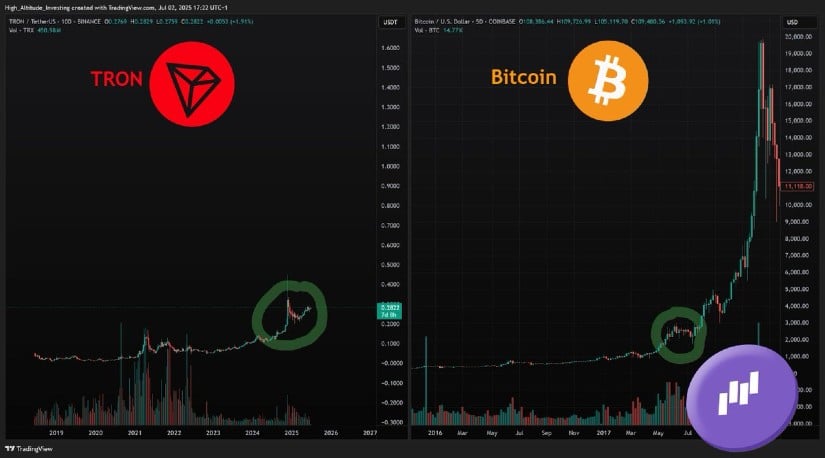
TRX price mirrors Bitcoin’s pre-breakout structure, with potential to push past $0.28 and target $0.35 and $0.44. Source: Dalin Anderson via X
From a TRX price prediction standpoint, holding above this current consolidation range is technically significant. If momentum continues and volume picks up, the next key resistance levels to watch are $0.35 and then the $0.44 high from early 2024.
On-Chain Strength Backs Technical Structure
While TRX has steadily climbed the charts with a clean technical setup, on-chain metrics are now echoing the same bullish tone. SunSwap is consistently crossing $3B in monthly swaps through 2025, with a record $3.8B in May alone. At the same time, JustLend deposits have tripled, now peaking around $740M, highlighting growing user engagement and confidence in the TRON ecosystem.
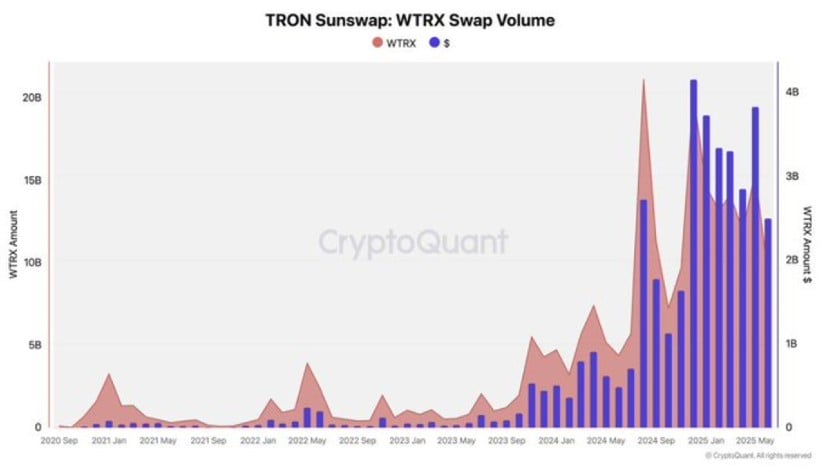
TRON sees strong on-chain support, with SunSwap and JustLend showing significant growth. Source: Crypto Aman via X
Final Thoughts: What Next for TRON?
With strong technical patterns, on-chain metrics backing up the bullish stance, and a clear trend of higher lows, TRON price is positioning itself for a potential breakout. As more participants look for stability in a weak market, TRON’s strength is becoming harder to ignore. If momentum continues, TRX may see steady gains, with key resistance levels like $0.35 and $0.44 firmly in sight.
As the TRON ecosystem shows increased user engagement and continues to build momentum, the bullish case for TRX becomes more convincing. If the current price structure holds, TRX will likely break through critical resistance zones and march toward its next targets.
]]>
As the leading cryptocurrency consolidates around the $108,000 mark, momentum indicators and technical patterns suggest an explosive move may be brewing—one that could define the next phase of the 2025 bull cycle.
Market Overview: Bitcoin Price Today Shows Steady Climb Toward Resistance
Bitcoin price today sits at approximately $108,200, up 0.64% in the last 24 hours. Despite muted trading activity, BTC has maintained its recent gains after a mild bounce from $107,300. The short-term chart structure shows a rising trend, but bulls must still overcome stiff resistance near $110,000.
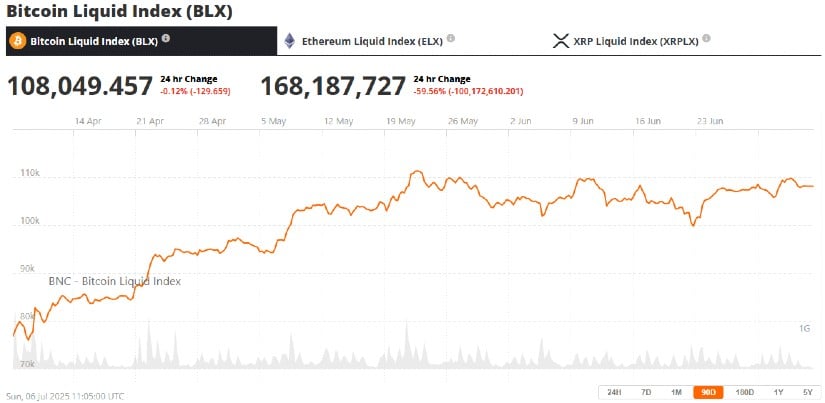
Bitcoin (BTC) was trading at around $108,032, down 0.15% in the last 24 hours at press time. Source: Bitcoin Liquid Index (BLX) via Brave New Coin
Technical indicators support a cautiously bullish outlook. The 1-hour BTC/USD chart reveals a mild recovery within a narrow range, while the 4-hour chart displays higher lows and short-term consolidation—often a precursor to larger moves. Key support levels remain at $107,800 and $106,300, while a breakout above $109,000 could open the door to $110,500 and beyond.
The MACD histogram is in positive territory (+279), and the RSI indicator stands at 55, indicating there’s still upside room before reaching overbought levels. Bitcoin’s 7-day SMA is $107,870, and the 30-day SMA sits at $106,177—both trending upward.
Momentum Builds: BTC Eyes $116K as the Gateway to $165K
Analysts have identified $116,000 as the breakout zone that could launch Bitcoin’s next parabolic rally. Crypto strategist Javon Marks recently projected that if BTC convincingly breaks this resistance, it could climb toward $165,745—a potential 52.5% gain from current levels.
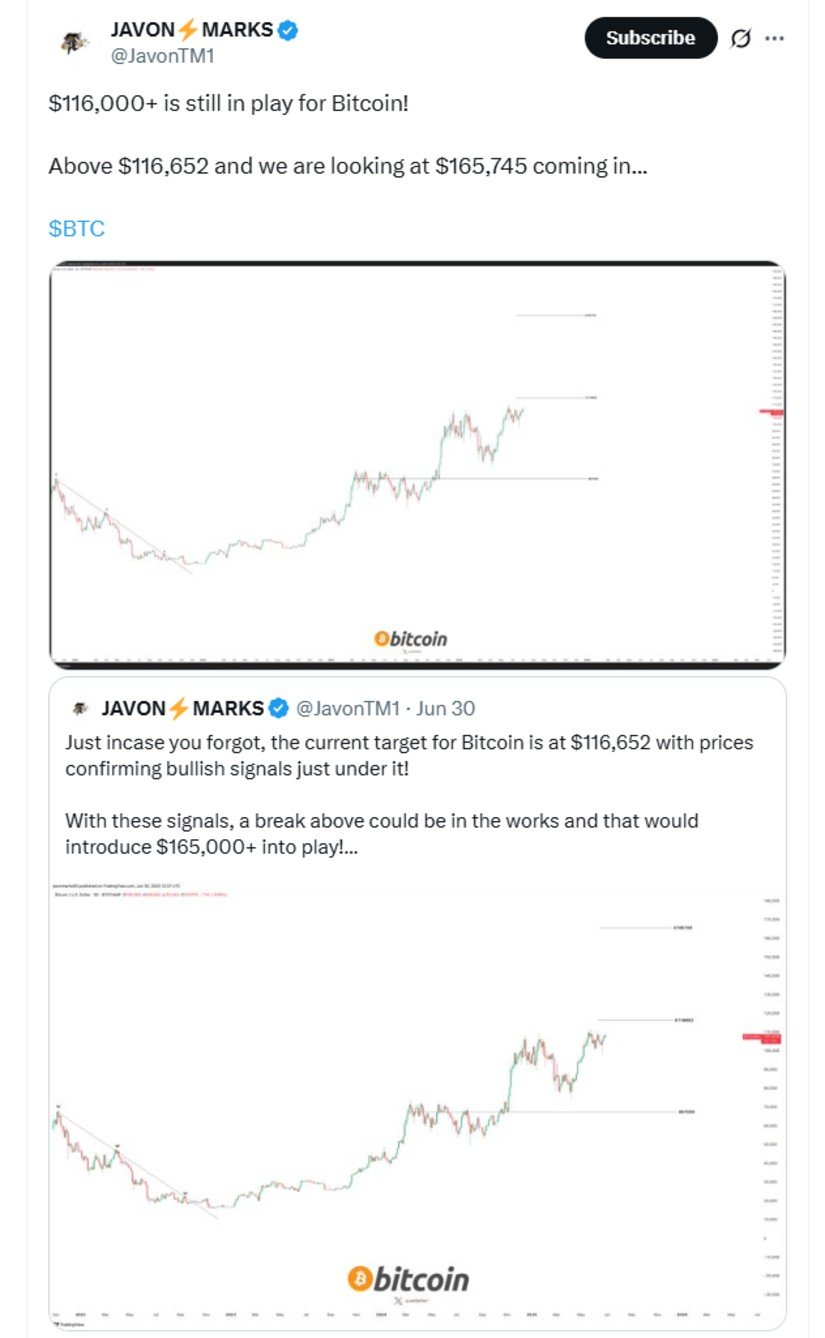
Bitcoin remains on track for a potential rally toward $165,745 if it breaks above the $116,652 resistance level. Source: Javon Marks via X
A bull flag pattern on the hourly chart also adds to the bullish case. A breakout above $111,980 could invalidate current consolidation and push BTC into the $120K–$145K range in the near term. Such price action would mirror previous Bitcoin rallies following similar technical setups.
Bitcoin Halving, Whale Activity, and ETF Buzz Add to Bullish Case
The key drivers are also working in tandem with the near-term technical setup. The 2025 halving of Bitcoin remains a powerful long-term driver, historically being the one to kick off supply shocks and price appreciation. Meanwhile, recent on-chain data showed in excess of $8 billion of inactive Bitcoin moved—later found to be long-term holder redistribution rather than a hack, settling sentiment.
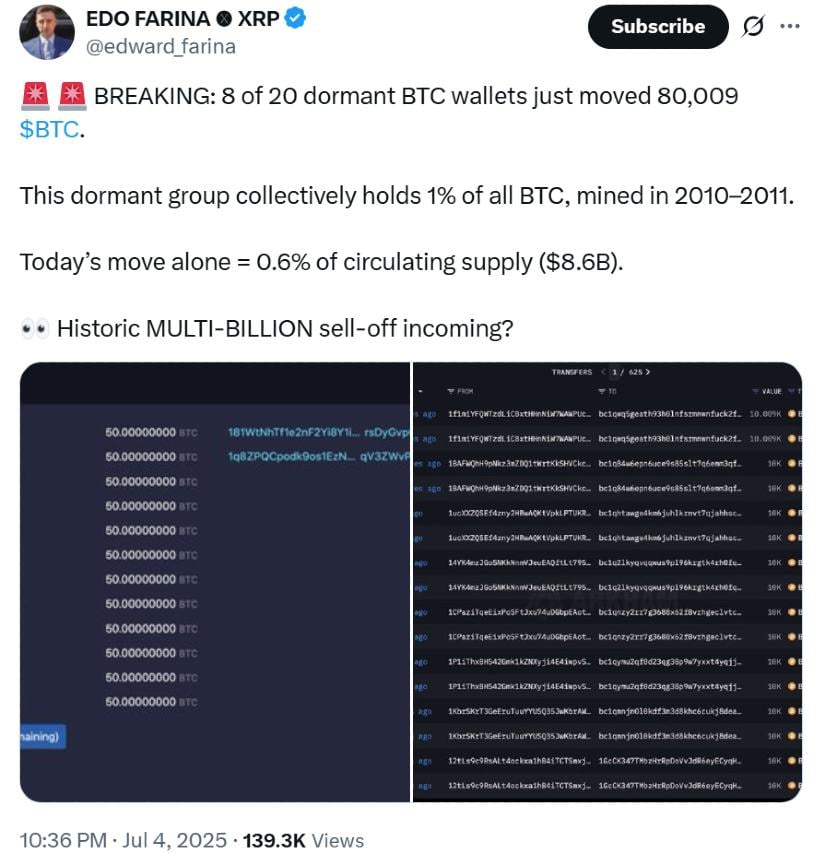
Eight dormant Bitcoin wallets moved 80,009 BTC today, representing 0.6% of the circulating supply and part of a group holding 1% of all BTC mined in 2010–2011. Source: Edward Farina via X
Also, the Bitcoin ETF news landscape continues to evolve. With the U.S. SEC approving rule amendments for greater ETF exposure and inflows into spot Bitcoin ETFs already surpassing over $49 billion, speculation about more institutional adoption continues to build. Analysts believe that another round of ETF-related momentum could push BTC into new all-time highs.
The Bitcoin whale alert community is also tracking sizable transfers as large holders reposition for what may be a decisive move. While volatility remains contained, behind-the-scenes activity hints that whales are preparing for something bigger.
Expert Insights: BTC Still Seen as a Hedge Against Inflation
As macroeconomic uncertainty persists, many analysts continue to view Bitcoin as an inflation hedge. With traditional markets showing signs of strain, BTC’s role as a non-sovereign asset remains appealing. According to macro strategist Julien Bittel, cycle-top indicators like the GMI Bitcoin Cycle Top Finder are currently inactive—something that historically occurs mid-cycle and ahead of major rallies.
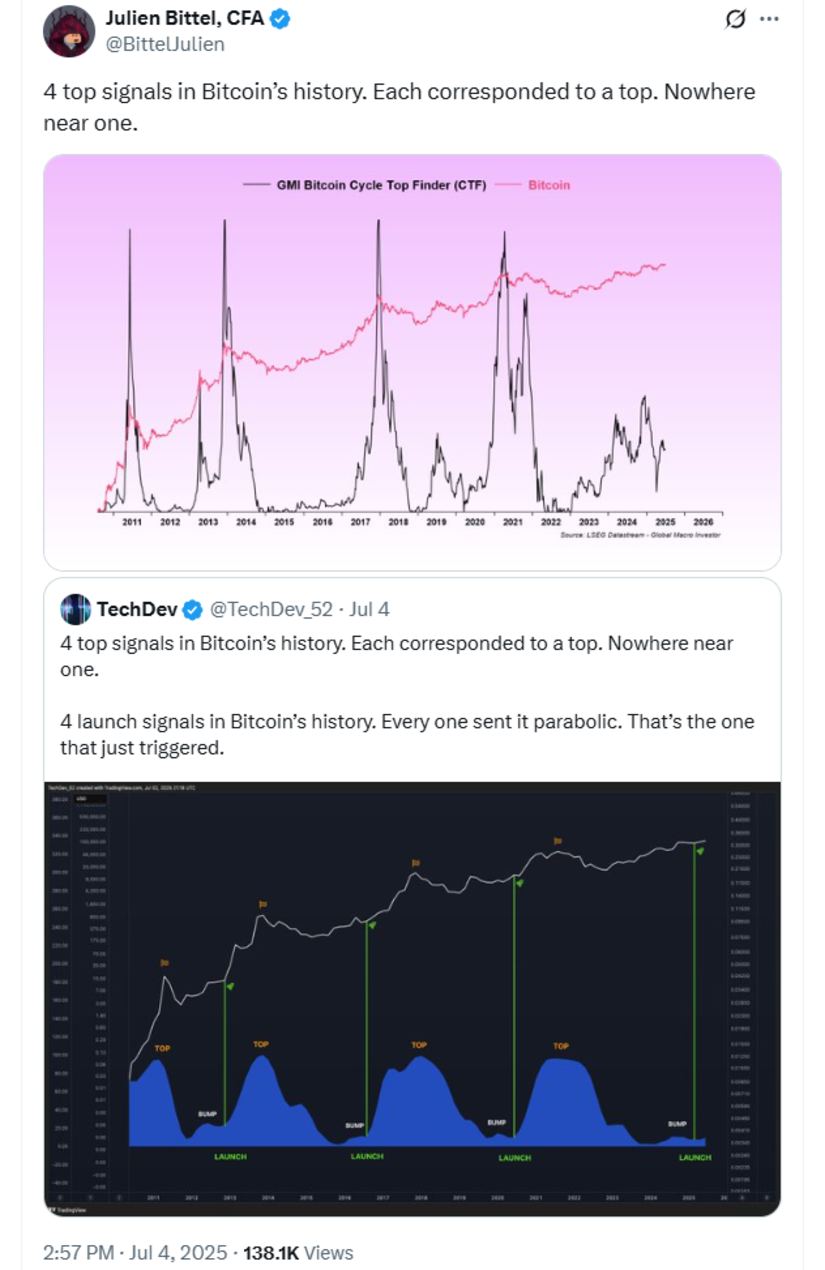
Bitcoin’s four historical top signals have all aligned with major peaks—and none are currently active. Source: @BittelJulien via X
This further supports the idea that Bitcoin has room to grow before reaching its peak this cycle. If momentum breaks through key resistance levels, analysts expect capital inflows to accelerate, especially from institutional players tracking long-term models.
Looking Ahead: BTC’s Next Move Could Define Q3—Will Bitcoin Break Out?
The Bitcoin price forecast may be made or broken in the next few days. If BTC can break and hold above $116K, analysts predict a fast advance towards the $160K–$165K region. Otherwise, more consolidation is possible with significant support at $106K and $107K to halt falls.
With rising technical pressure, on-chain activity, ETF tailwinds, and macro support, Bitcoin appears to be creeping towards its breakout zone. Whether this is the start of the next big rally or another pause in the uptrend will depend on how BTC reacts to the upcoming resistance.
For now, all eyes remain on the $116K line. Break that—and Bitcoin’s next stop could be $165K.
]]>
Dormant whale moves 40,000 BTC after 14 years of inactivity, causing price volatility amid broader institutional adoption trends
Crypto markets experienced a brief tremor this week as one of Bitcoin’s largest holders made their first move in over a decade, highlighting the continuing influence of early adopters in an increasingly institutionalized market.
Massive Transfer Breaks 14-Year Silence
The analysis shows that the Bitcoin OG moved 40,000 BTC from four of his eight wallets today, with the coins originally acquired at around $1.65 each being moved in 10,000 BTC increments over a 10-hour period.
According to The Crypto Basic, the whale is believed to control over 80,000 BTC across multiple wallets, with the remaining coins still untouched. The identity of the holder remains unknown, though speculation on social media platforms has ranged from early “Satoshi-era” investors to prominent figures from Bitcoin’s early days.
Part of a Broader Whale Movement Pattern
This massive transfer was not an isolated event. Recent analysis by blockchain analytics firms reveals a pattern of old Bitcoin whales becoming active in 2025. Decrypt reported that the whale movement constituted the “largest daily transfer of old BTC in history,” with some estimates suggesting the total value moved exceeded $8 billion when considering related transactions.
The timing coincides with what Bitcoin Ethereum News describes as a fundamental shift in Bitcoin’s market behavior, marked by diminishing selling pressure from major holders and increased institutional accumulation. This dual dynamic is fostering a more stable and bullish environment for the cryptocurrency.
Market Responds with Cautious Decline
Despite the massive scale of the transfer, market reaction was relatively muted. Bitcoin’s price fell 1.47% on the day of the transfer, closing at $108,034.34 after opening at $109,635.66. This decline marked a shift from the relative stability seen in preceding days, which had shown gains of 3% on July 2 and 0.72% on July 3.
The price continued to drift lower over the following days, with minor declines of 0.18% and 0.28% on July 5 and 6 respectively, suggesting lingering market uncertainty about the whale’s intentions. However, the limited impact reflects the market’s growing maturity and the absence of panic selling that might have occurred in Bitcoin’s earlier years.
Institutional Context Moderates Impact
The muted market response can be attributed partly to the changing composition of Bitcoin ownership. AInvest reports that institutional interest in Bitcoin has surged in 2025, with BlackRock, the world’s largest asset manager, quietly accumulating $3.85 billion worth of Bitcoin in June 2025 alone. This institutional buying power has provided a stabilizing force against large whale movements.
Evolving Market Dynamics
The crypto landscape has evolved significantly since the whale’s last activity in 2010. According to CoinTelegraph’s analysis, Bitcoin developer activity has surged in 2025, with over 3,200 commits recorded across its repositories in the past year, marking a significant rebound from the 2022 slowdown.
This technical development, combined with increased institutional adoption, has created a more resilient market structure. The influx of institutional capital has fundamentally altered Bitcoin’s trajectory in 2025, with a significant portion of institutional portfolios now including digital assets, heralding a new phase of market maturity.
The lack of exchange activity has been key to limiting market impact, as traders typically fear that large transfers signal impending sell-offs that could drive prices down. CoinDesk noted that the latest transfers showed no signs of a profit-taking operation, further calming market concerns.
Historical Context Provides Perspective
Research from the Blockchain Research Lab analyzing large Bitcoin transfers shows that non-exchange movements typically cause less market disruption than exchange-bound transactions. The study found that transfers not involving exchanges account for about 20% of large Bitcoin movements and generally create uncertainty but limited immediate price impact.
The pattern observed in the July 4 transfer aligns with historical data showing that prices often dip following large whale movements but recover when the coins don’t enter active trading circulation.
Broader Market Implications and Future Outlook
The event highlights the cryptocurrency market’s continued sensitivity to large holders despite Bitcoin’s maturation. While the immediate impact was relatively muted, the transfer demonstrates how whale activity can still influence market sentiment and short-term price movements, even in an era of increased institutional participation.
For retail investors, such events serve as reminders of the importance of monitoring on-chain activity and maintaining diversified portfolios. The crypto community’s intense focus on whale movements also underscores the market’s transparency, where large transactions are visible to all participants through blockchain analysis tools.
Looking ahead, the pattern of dormant whale reactivations may continue throughout 2025. As BeInCrypto analysis suggests, the resurgence of old Bitcoin whales reflects shifting sentiments among major investors and could shape Bitcoin’s price trends in the coming months.
The long-term impact of the July 2025 transfer remains to be seen and will largely depend on the whale’s next moves. Market analysts suggest that unless the coins enter active circulation through exchanges, the impact will likely remain limited to short-term volatility, especially given the counterbalancing effect of institutional accumulation.
Regulatory Considerations
Large, unexplained transfers can attract regulatory attention, potentially leading to increased oversight of cryptocurrency markets. While improved transparency could stabilize markets, it may also introduce new compliance complexities for investors and institutions.
Looking Ahead
The long-term impact of the July 2025 transfer remains to be seen and will largely depend on the whale’s next moves. Market analysts suggest that unless the coins enter active circulation through exchanges, the impact will likely remain limited to short-term volatility.
The incident serves as a reminder that despite Bitcoin’s growth and institutional adoption, individual large holders still possess significant influence over market dynamics. For the broader crypto ecosystem, it underscores the importance of continued market development and liquidity growth to reduce the impact of single large transactions.
As the identity and intentions of the whale remain unknown, the crypto community continues to monitor the situation closely, with many using blockchain analysis tools to track any further movements of these significant holdings.
]]>